Stars4Water
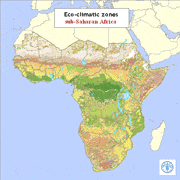
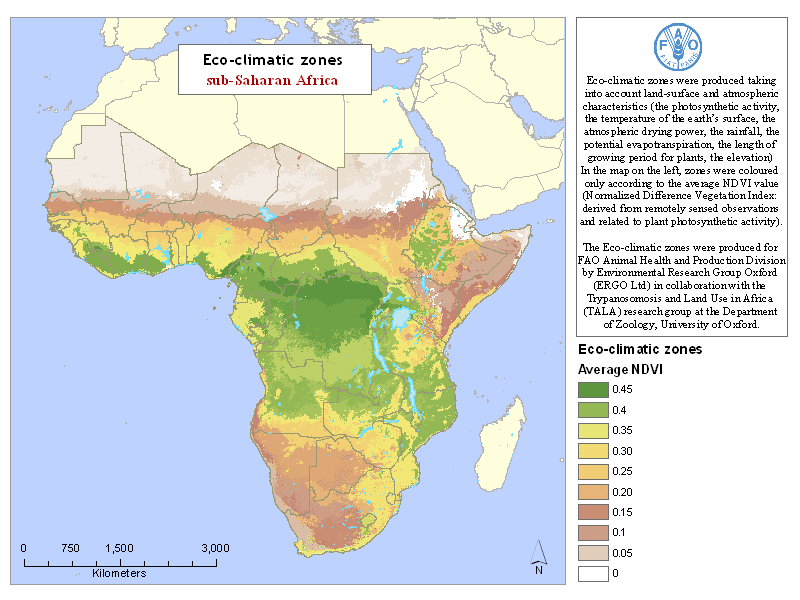
Eco-climatic zones of sub-Saharan Africa
Eco-climatic zones were produced taking into account land-surface and atmospheric characteristics (the photosynthetic activity, the temperature of the earth?s surface, the atmospheric drying power, the rainfall, the potential evapotranspiration, the length of growing period for plants, the surface elevation). Most of these features could be accurately predicted using satellite data; some others needed a combination of remotely sensed and ground-based data. Remotely sensed data were acquired by NOAA-AVHRR sensor and by Meteosat satellite. The AVHRR satellite data were available in dekadal images for a 13 year series from 1982-1994. Meteosat imagery runs from 1988 to 1997.
The information layer was produced for FAO in January 1999 by Environmental Research Group Oxford (ERGO Ltd) in collaboration with the Trypanosomosis and Land Use in Africa (TALA) research group at the Department of Zoology, University of Oxford.
Simple
- Date (Creation)
- 1999-01-31
- Edition
-
first
- Presentation form
- Digital map
- Purpose
-
The dataset was produced for the PAAT-IS (Programme Against African Trypanosomiasis ? information System). This is Programme aimed at harmonizing and coordinating the activities of the four mandated international organizations (AU, FAO, IAEA, WHO) in relation to tsetse and trypanosomiasis intervention.
- Status
- Completed
- Maintenance and update frequency
- As needed
- Theme
-
-
ecozone
-
- Place
-
-
South of Sahara
-
- Access constraints
- Copyright
- Spatial representation type
- Grid
- Metadata language
-
eng
- Character set
- UTF8
- Topic category
-
- Biota
- Health
- Environment
- Farming
))
- Supplemental Information
-
For the definition of eco-climatic zone, the following satellite-derived measures of land-surface or atmospheric characteristics were used:
? Normalised Difference Vegetation Index (NDVI) from the Advanced Very High Resolution Radiometer (AVHRR) commonly used as an indicator of vegetation cover (data from the Pathfinder Program, initially supplied by the NASA Global Inventory Monitoring and Modelling Systems (GIMMS) group);
? A measure of ground surface temperature, derived using the Price split window technique, from two of the thermal channels (Channel 4 and 5) of the same instrument that produces NDVI data (Price, 1984);
? A measure of middle infrared reflectance (allied to temperature but less susceptible to atmospheric interference) derived from Channel 3 of the AVHRR data;
? A measure of Vapour Pressure Deficit also derived from the AVHRR channels 4 and 5 and ancillary processing;
? A measure of surface rainfall, the Cold Cloud Duration (CCD), derived from the METEOSAT satellite (from FAO ARTEMIS).
All the AVHRR satellite data were available in dekadal images for a 13 year series from 1982-1994. The CCD imagery runs from 1988 to 1997. Each series was subjected to temporal Fourier analysis, re-sampled to 0.05 degree resolution and re-projected to latitude/longitude (geographic) projection where necessary. Fourier processing extracts, from each multi-temporal data stream, the characteristics of the annual, biannual and tri-annual components, details of which are given in Rogers, Hay & Packer (1996). Mean values, and the amplitudes and phases (i.e. timing of the seasonal peaks) of the annual, bi-annual and tri-annual cycles were recorded, together with the maximum, minimum and ranges (maximum - minimum) of each Fourier description of the observed signal. The percentage of the total variance attributable to each of the three Fourier components (a measure of the relative importance of each component) was also calculated for each parameter series.
Other datasets used for the definition of eco-climatic zone were:
? Digital Elevation Model (DEM) data were obtained from the GTOPO30 1km resolution, produced by the Global Land Information System (GLIS) of the United States Geological Survey, Earth Resources Observation Systems (USGS, EROS) data centre.
The Eco-climatic zones were defined using the ADDAPIX software to provide unsupervised classifications of sub-Saharan Africa based on elevation and 25 remotely sensed variables: the minimum, maximum, range, mean and Fourier component phase 1 of each of NDVI, Channel 3, Price temperature, VPD, and CCD. This differs slightly from the ecozonation used in previous works in the incorporation of the Fourier Phase 1 variable. This essentially quantifies the timing of the seasonal peak in the annual cycle for each variable, and thus helps to differentiate between areas with similar eco-climatic characteristics in the northern and southern hemisphere.
- Reference system identifier
- WGS 1984
- Number of dimensions
- 1450
Axis Dimensions Properties
- Dimension name
- Column
- Dimension size
- 1400
- Resolution
- 0.05 ,
- Cell geometry
- Area
- Transformation parameter availability
- No
- Distribution format
-
-
TIFF
(
)
-
TIFF
(
)
- OnLine resource
- Programme Against African Trypanosomiasis - Information System ( WWW:LINK-1.0-http--link )
- OnLine resource
-
Ecozones.zip
(
WWW:DOWNLOAD-1.0-http--download
)
Eco-climatic zones
- OnLine resource
-
asaflgprep.zip
(
WWW:DOWNLOAD-1.0-http--download
)
Report: Agro-Ecological Zones, Farming Systems and Land Pressure in Africa and Asia
- OnLine resource
- Environmental Research Group Oxford ( WWW:LINK-1.0-http--link )
Data quality info
- File identifier
- f90fb2f0-88fd-11da-a88f-000d939bc5d8 XML
- Metadata language
-
eng
- Character set
- UTF8
- Date stamp
- 2025-03-03T11:48:34
- Metadata standard name
-
ISO 19115:2003/19139
- Metadata standard version
-
1.0
Overviews
Spatial extent
Provided by