 Stars4Water
250 m
Type of resources
Available actions
Topics
Keywords
Contact for the resource
Provided by
Formats
Representation types
status
Resolution
-
Bulk density (fine earth) in cg/cm³ at 6 standard depths. Predictions were derived using a digital soil mapping approach based on Quantile Random Forest, drawing on a global compilation of soil profile data and environmental layers. To visualize these layers please use www.soilgrids.org.
-
Silt content (2-50/63 micro meter) mass fraction in ‰ at 6 standard depths. Predictions were derived using a digital soil mapping approach based on Quantile Random Forest, drawing on a global compilation of soil profile data and environmental layers. To visualize these layers please use www.soilgrids.org.
-
Clay content (0-2 micro meter) mass fraction in ‰ at 6 standard depths. Predictions were derived using a digital soil mapping approach based on Quantile Random Forest, drawing on a global compilation of soil profile data and environmental layers. To visualize these layers please use www.soilgrids.org.
-
Sand content (50/63-2000 micro meter) mass fraction in ‰ at 6 standard depths. Predictions were derived using a digital soil mapping approach based on Quantile Random Forest, drawing on a global compilation of soil profile data and environmental layers. To visualize these layers please use www.soilgrids.org.
-
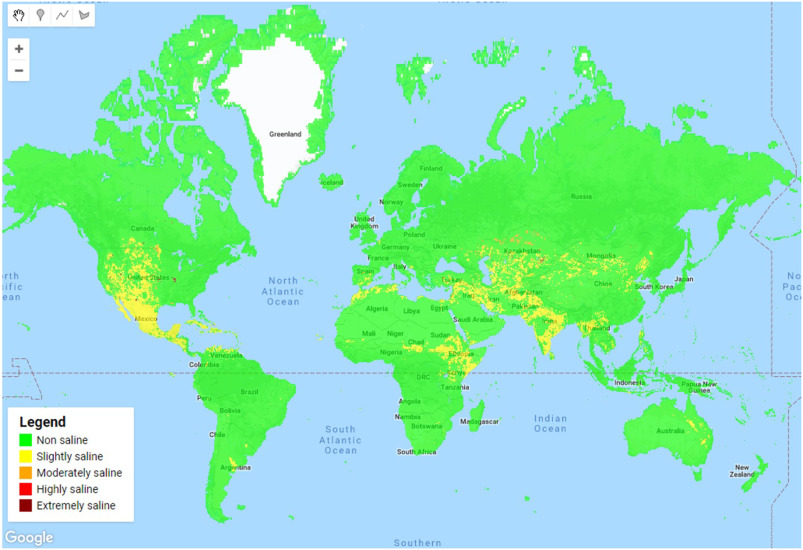
This dataset includes global soil salinity layers for the years 1986, 1992, 2000, 2002, 2005, 2009 and 2016. The maps were generated with a random forest classifier that was trained using seven soil properties maps, thermal infrared imagery and the ECe point data from the WoSIS database. The validation accuracy of the resulting maps was in the range of 67–70%. The total area of salt affected lands by our assessment is around 1 billion hectares, with a clear increasing trend. Further details are provided in a peer-reviewed journal article (https://doi.org/10.1016/j.rse.2019.111260). The code and data used to produce the global soil salinity maps can be accessed by registered Google Earth Engine users at https://code.earthengine.google.com/d43e5a92ae1deed32a0929f57b572756.
-
Soil pH x 10 in H2O at 6 standard depths (to convert to pH values divide by 10). Predictions were derived using a digital soil mapping approach based on Quantile Random Forest, drawing on a global compilation of soil profile data and environmental layers. To visualize these layers please use www.soilgrids.org.