 Stars4Water
environment
Type of resources
Available actions
Topics
Keywords
Contact for the resource
Provided by
Years
Formats
Representation types
Update frequencies
status
Scale
Resolution
-

The map summarizes the status of the land use and land cover at global scale. It was compiled according to the current GAEZ (Global Agro-Ecological Zones) -2009 approach, developed by FAO in collaboration with IIASA (International Institute for Applied Systems Analysis).The current Global AEZ (GAEZ-2009) offers a standardized framework for the characterization of climate, soil and terrain conditions relevant to agricultural production, which can be applied at global to sub-national levels. The map is based on six geographic datasets: - GLC2000 land cover database at 30 arc-sec (http://www-gvm.jrc.it/glc2000), using regional and global legends (JRC, 2006); - an IFPRI global land cover categorization providing 17 land cover classes at 30 arc-sec. (IFPRI, 2002), based on a reinterpretation of the Global Land Cover Characteristics Database (GLCC ver. 2.0), EROS Data Centre (EDC, 2000); - FAO’s Global Forest Resources Assessment 2000 and 2005 (FAO, 2001; FAO, 2006) at 30 arc-sec. resolution; - digital Global Map of Irrigated Areas (GMIA) version 4.0 of (FAO/University of Frankfurt) at 5’ by 5’ latitude/longitude resolution, providing by grid-cell the percentage land area equipped with irrigation infrastructure (Siebert et al., 2007); - a spatial population density inventory (30-arc seconds) for year 2000 developed by FAO-SDRN, based on spatial data of LANDSCAN 2003, with calibration to UN 2000 population figures. An iterative calculation procedure has been implemented to estimate land cover class weights, consistent with aggregate FAO land statistics and spatial land cover patterns obtained from remotely sensed data, allowing the quantification of major land use/land cover shares in individual 5’ by 5’ latitude/longitude grid cells.
-

This map provides a representation of levels of water scarcity by major hydrological basin, expressed in terms of the ratio between irrigation water that is consumed by plants through evapotranspiration and renewable fresh water resources. Contrarily to previous water scarcity maps, this map uses consumptive use of water rather than water withdrawal. Renewable fresh water resources as well as net irrigation water requirements in the river basin are calculated through a water balance model, with information regarding climate, soils and irrigated agriculture as input data. The legend distinguishes three classes: • Water scarcity in river basins where evapotranspiration due to irrigation is less than 10% of the total renewable water resources is classified as low; • Water scarcity in river basins where evapotranspiration due to irrigation is in between 10% and 20% of the total renewable water resources is classified as moderate; • Water scarcity in river basins where evapotranspiration due to irrigation is more than 20% of the total renewable water resources is classified as high.
-

This vector layer represents the Okavango Delta System Ramsar site within the Okavango River Basin. Source: The RAMSAR Convention on Wetlands. This dataset is part of the GIS Database for the Environment Protection and Sustainable Management of the Okavango River Basin project (EPSMO). Detailed information on the database can be found in the “GIS Database for the EPSMO Project†document produced by Luis Veríssimo (FAO consultant) in July 2009, and here available for download.
-
The map shows the ratio of total withdrawals to the available renewable water resource. Renewable water resources are downscaled to a five arc-minute grid. Water is considered scarce when the withdrawals exceed 40% of the renewable resource. According to statistics compiled by FAO (FAOSTAT),several countries in North Africa, the Middle East and Central Asia withdraw more water than their total renewable resources. Domestic water withdrawals are downscaled by applying the per capita domestic water use to population of each pixel. Industrial water withdrawals were downscaled by using the industrial water use per unit GDP and applying downscaled information on GDP. Water consumption is assumed to be 30% of domestic use and 10% of industrial use. Finally, agricultural water consumption is assumed to be the crop water deficit in irrigated areas generated in the AEZ analysis and water used for livestock consumption, applied to a global spatial data set of livestock distribution prepared by FAO.Source of the map: GAEZ 2009 and AQUASTAT; downscaling simulations by authors.
-
The map shows the total annual water withdrawal. Water withdrawals are downscaled to to a five arc-minute grid. Water is considered scarce when the withdrawals exceed 40% of the renewable resource. According to statistics compiled by FAO (FAOSTAT), several countries in North Africa, the Middle East and Central Asia withdraw more water than their total renewable resources. Domestic water withdrawals are downscaled by applying the per capita domestic water use to population of each pixel. Industrial water withdrawals were downscaled by using the industrial water use per unit GDP and applying downscaled information on GDP. Water consumption is assumed to be 30% of domestic use and 10% of industrial use. Finally, agricultural water consumption is assumed to be the crop water deficit in irrigated areas generated in the AEZ analysis and water used for livestock consumption, applied to a global spatial data set of livestock distribution prepared by FAO. Source of the map: GAEZ 2009 and AQUASTAT; downscaling simulations by authors.
-
This map, compiled to support the analysis of SOLAW report concerning trends and current use of water use in agriculture, shows the percentage of irrigated area supplied by groundwater. Irrigation mainly relies on renewable freshwater resources, either surface water or groundwater. However, while the extent of irrigation and related water uses are reported in statistical databases or by model simulations, information on the source of irrigation water is still very rare. A recent global inventory undertaken by FAO and the University of Bonn reports that 113 million ha, or 38 percent of the total area equipped for irrigation of 301 million ha, is irrigated by groundwater (Siebert et al, 2010).
-
A set of 4 vector data, derived from the World Database on Protected Areas WDPA/IUCN (2009), representing le following layers: -Protected Areas; -Conservation managed units; -Hunting Management Areas; -Forest Reserves. Source: WDPA/IUCN (2009). The WDPA Annual Release includes all nationally designated (e.g. National Parks, Nature Reserves) and internationally recognized protected areas (e.g. UNESCO World Heritage Sites, Wetlands of International Importance) currently held in the WDPA, up to end of February 2009. This static version contains all data improvements made to the WDPA since the previous annual release in December 2007. This dataset is part of the GIS Database for the Environment Protection and Sustainable Management of the Okavango River Basin project (EPSMO). Detailed information on the database can be found in the “GIS Database for the EPSMO Project†document produced by Luis Veríssimo (FAO consultant) in July 2009, and here available for download.
-
This map shows the extent of land area equipped for irrigation -expressed as percentage- around the turn of the 20th century according to the Global Map of Irrigation Areas (version 4.0.1), together with areas of rainfed agriculture. Data are available from AQUASTAT - programme of the Land and Water Division of the Food and Agriculture Organization of the United Nations.
-
On the basis of soil parameters provided by the Harmonized World Soil Database (HWSD) seven key soil qualities important for crop production have been derived, namely: nutrient availability, nutrient retention capacity, rooting conditions, oxygen availability to roots, excess salts, toxicities, and workability. Soil qualities are related to the agricultural use of the soil and more specifically to specific crop requirements and tolerances. For the illustration of soil qualities, maize was selected as reference crop because of its global importance and wide geographical distribution. Rooting conditions (SQ3) Rooting conditions include effective soil depth (cm) and effective soil volume (vol. %) related to presence of gravel and stoniness. Rooting conditions may be affected by the presence of a soil phase either limiting the effective rooting depth or decreasing the effective volume accessible for root penetration. Rooting conditions address various relations between soil conditions of the rooting zone and crop growth. The following factors are considered in the evaluation: Adequacy of foothold, i.e., sufficient soil depth for the crop for anchoring; available soil volume and penetrability of the soil for roots to extract nutrients; space for root and tuber crops for expansion and economic yield in the soil; and absence of shrinking and swelling properties (vertic) affecting root and tuber crops. Soil depth/volume limitations affect root penetration and may constrain yield formation (roots and tubers). Relevant soil properties considered are: soil depth, soil texture/structure, vertic properties, gelic properties, petric properties and presence of coarse fragments. This soil quality is estimated by multiplying of the soil depth limitation with the most limiting soil or soil phase property Soil phases that relevant for rooting conditions vary somewhat with source of soil map and soil classification used. In the HWSD these are: FAO 74 soil phases: stony, lithic, petric, petrocalcic, petrogypsic, petroferric, fragipan and duripan. FAO 90 soil phases: rudic, lithic, pertroferric, placic, skeletic, fragipan and duripan. ESB soil phases and other soil depth/volume related characteristics: stony, lithic, petrocalcic, petroferric, fragipan and duripan, and presence of gravel or concretions, obstacles to roots (6 classes), and impermeable layers (4 classes). Note that the classes used in the Soil Quality evaluation are: 1: No or slight limitations 2: Moderate limitations 3: Sever limitations 4: Very severe limitations 5: Mainly non-soil 6: Permafrost area 7: Water bodies Remember that classes are qualitative not quantitative. Only classes 1 to 4 are corresponding to an assessment of soil limitations for plant growth. Class 1 is generally rated between 80 and 100% of the growth potential, class 2 between 60 and 80%, class 3 between 40 and 60%, and class 4 less than 40%.
-
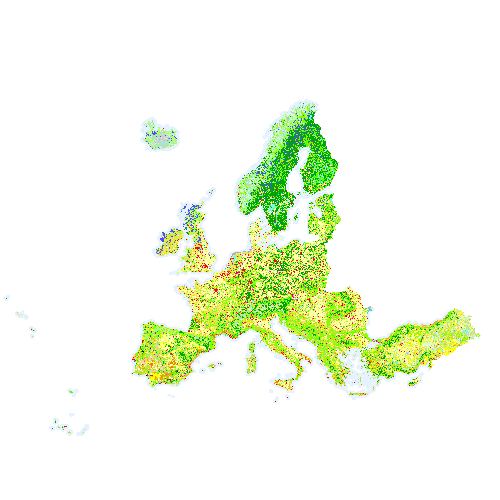
Corine Land Cover 2018 (CLC2018) is one of the Corine Land Cover (CLC) datasets produced within the frame the Copernicus Land Monitoring Service referring to land cover / land use status of year 2018. CLC service has a long-time heritage (formerly known as "CORINE Land Cover Programme"), coordinated by the European Environment Agency (EEA). It provides consistent and thematically detailed information on land cover and land cover changes across Europe. CLC datasets are based on the classification of satellite images produced by the national teams of the participating countries - the EEA members and cooperating countries (EEA39). National CLC inventories are then further integrated into a seamless land cover map of Europe. The resulting European database relies on standard methodology and nomenclature with following base parameters: 44 classes in the hierarchical 3-level CLC nomenclature; minimum mapping unit (MMU) for status layers is 25 hectares; minimum width of linear elements is 100 metres. Change layers have higher resolution, i.e. minimum mapping unit (MMU) is 5 hectares for Land Cover Changes (LCC), and the minimum width of linear elements is 100 metres. The CLC service delivers important data sets supporting the implementation of key priority areas of the Environment Action Programmes of the European Union as e.g. protecting ecosystems, halting the loss of biological diversity, tracking the impacts of climate change, monitoring urban land take, assessing developments in agriculture or dealing with water resources directives. CLC belongs to the Pan-European component of the Copernicus Land Monitoring Service (https://land.copernicus.eu/), part of the European Copernicus Programme coordinated by the European Environment Agency, providing environmental information from a combination of air- and space-based observation systems and in-situ monitoring. Additional information about CLC product description including mapping guides can be found at https://land.copernicus.eu/user-corner/technical-library/. CLC class descriptions can be found at https://land.copernicus.eu/user-corner/technical-library/corine-land-cover-nomenclature-guidelines/html/.