 Stars4Water
dataset
Type of resources
Available actions
Topics
Keywords
Contact for the resource
Provided by
Years
Formats
Representation types
Update frequencies
status
Scale
Resolution
-

This vector layer (line) – reference scale 1/200 000 – is a drainage network model of the CORB-Contributing area. In the attributes table, each drainage line is linked to the micro catchment in which it resides. The creation of this layer was achieved by converting the Steam Segmentation grid layer into vector layer. This dataset is part of the GIS Database for the Environment Protection and Sustainable Management of the Okavango River Basin project (EPSMO). Detailed information on the database can be found in the “GIS Database for the EPSMO Project†document produced by Luis Veríssimo (FAO consultant) in July 2009, and here available for download.
-
As part of the the World Bank's review of its rural development strategy, the Bank sought the assistance of the Food and Agriculture Organization of the United Nations (FAO) in evaluating how farming systems might change and adapt over the next thirty years. Amongst other objectives, the World Bank asked FAO to provide guidance on priorities for investment in food security, poverty reduction, and economic growth, and in particular to identify promising approaches and technologies that will contribute to these goals. The results of the study are summarized in a set of seven documents, comprising six regional reports and the global overview contained in this volume. This document, which synthesises the results of the six regional analyses as well as discussing global trends, cross-cutting issues and possible implementation modalities, presents an overview of the complete study. This document is supplemented by two case study reports of development issues of importance to farming systems globally.
-
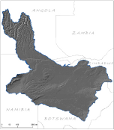
This raster layer represents the hill shade model within the Okavango Basin. Source: Data generated under the GIS EPSMO program (base:OB_DTM). This dataset is part of the GIS Database for the Environment Protection and Sustainable Management of the Okavango River Basin project (EPSMO). Detailed information on the database can be found in the “GIS Database for the EPSMO Project†document produced by Luis Veríssimo (FAO consultant) in July 2009, and here available for download.
-
The database contains long time-series of demographic and socio-economic variables and indicators for EU27 regions at various statistical scales (NUTS1, NUTS2, NUTS3, metro regions). Upon data availability, regions in EFTA and candidate countries are also covered. ARDECO is updated on a quarterly basis. Data includes Population, Domestic Product, Employment, Labour Cost, Labour Productivity, Capital Formation, Capital Stock, Households. The main source is EUROSTATS
-
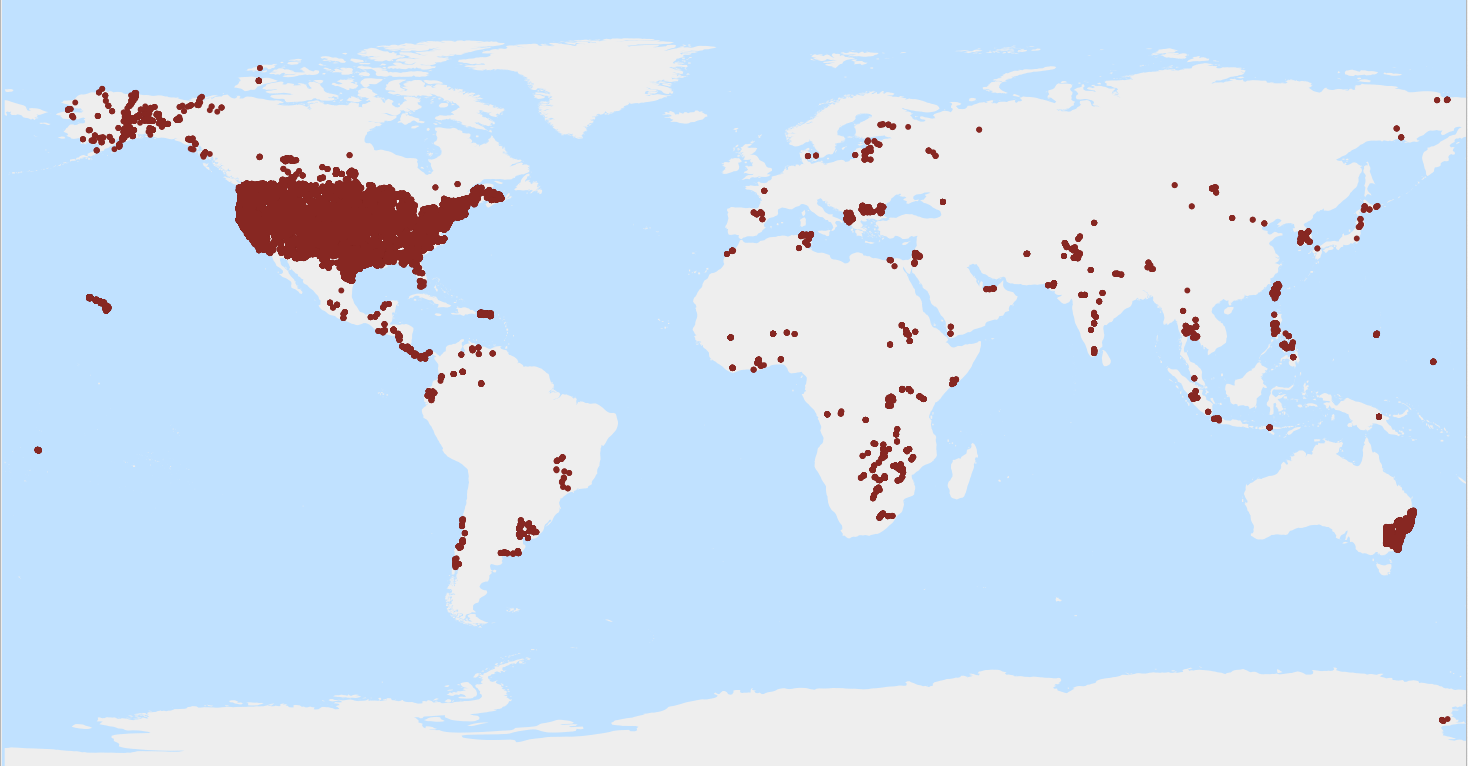
Soil moisture content by weight, at tension 33 kPa (pF 2.5) (g/100g). WoSIS_latest is a 'dynamic dataset' that contains the most recent complement of quality-assessed and standardised soil data served from WoSIS (ISRIC World Soil Information Service). The source data were shared by a wide range of data providers (see: https://www.isric.org/explore/wosis/wosis-contributing-institutions-and-experts). Being dynamic, the contents of 'wosis_latest' will change once new point data are acquired, cleansed and standardised, additional soil properties are considered, and/or when possible amendments are required. Static snapshots of 'wosis_latest' are released at irregular intervals for consistent citation purposes and to discuss methodological changes; the last snapshot is available at https://doi.org/10.5194/essd-16-4735-2024. For general information about WoSIS please see the FAQ-page at https://www.isric.org/explore/wosis/faq-wosis.
-
20 years of means of climate indices (e.g. mean annual temperature), calculated from daily time series from the RCMs under the EUROCORDEX
-

Derived from the Global Agro-Ecological Zones Study, Food and Agriculture Organization of the United Nations (FAO), Land and Water Development Division (AGL) with the collaboration of the International Institute for Applied Systems Analysis (IIASA), 2000. Data averaged over a period of 37 years. Raster data-set has been exported as ASCII raster file type.
-

Moisture regime classification at about 9 km resolution at the equator, using different climate data source and based on different Representative Concentration Pathways (RCPs) according to the time period as follows: - climate data source CRUTS32 based on historical data for the time period 1981-2010; - climate data source ENSEMBLE based on the Representative Concentration Pathway RCP8.5 for time periods 2041-2070 and 2071-2100. The Moisture regime classification dataset is part of the GAEZ v4 Theme 1 Land and Water Resources, Agro-Ecological Zones sub-theme. The agro-ecological zones classification provides a characterization of bio-physical resources relevant to agricultural production systems. AEZ definitions and map classes follow a rigorous methodology and an explicit set of principles. The inventory combines spatial layers of thermal and moisture regimes with broad categories of soil/terrain qualities. It also indicates locations of areas with irrigated soils and shows land with severely limiting bio-physical constraints including very cold and very dry (desert) areas as well as areas with very steep terrain or very poor soil/terrain conditions. For further details, please refer to the GAEZ v4 Model Documentation.
-

Bulk density of the whole soil including coarse fragments, air dried (kg/dm³). WoSIS_latest is a 'dynamic dataset' that contains the most recent complement of quality-assessed and standardised soil data served from WoSIS (ISRIC World Soil Information Service). The source data were shared by a wide range of data providers (see: https://www.isric.org/explore/wosis/wosis-contributing-institutions-and-experts). Being dynamic, the contents of 'wosis_latest' will change once new point data are acquired, cleansed and standardised, additional soil properties are considered, and/or when possible amendments are required. Static snapshots of 'wosis_latest' are released at irregular intervals for consistent citation purposes and to discuss methodological changes; the last snapshot is available at https://doi.org/10.5194/essd-16-4735-2024. For general information about WoSIS please see the FAQ-page at https://www.isric.org/explore/wosis/faq-wosis.
-
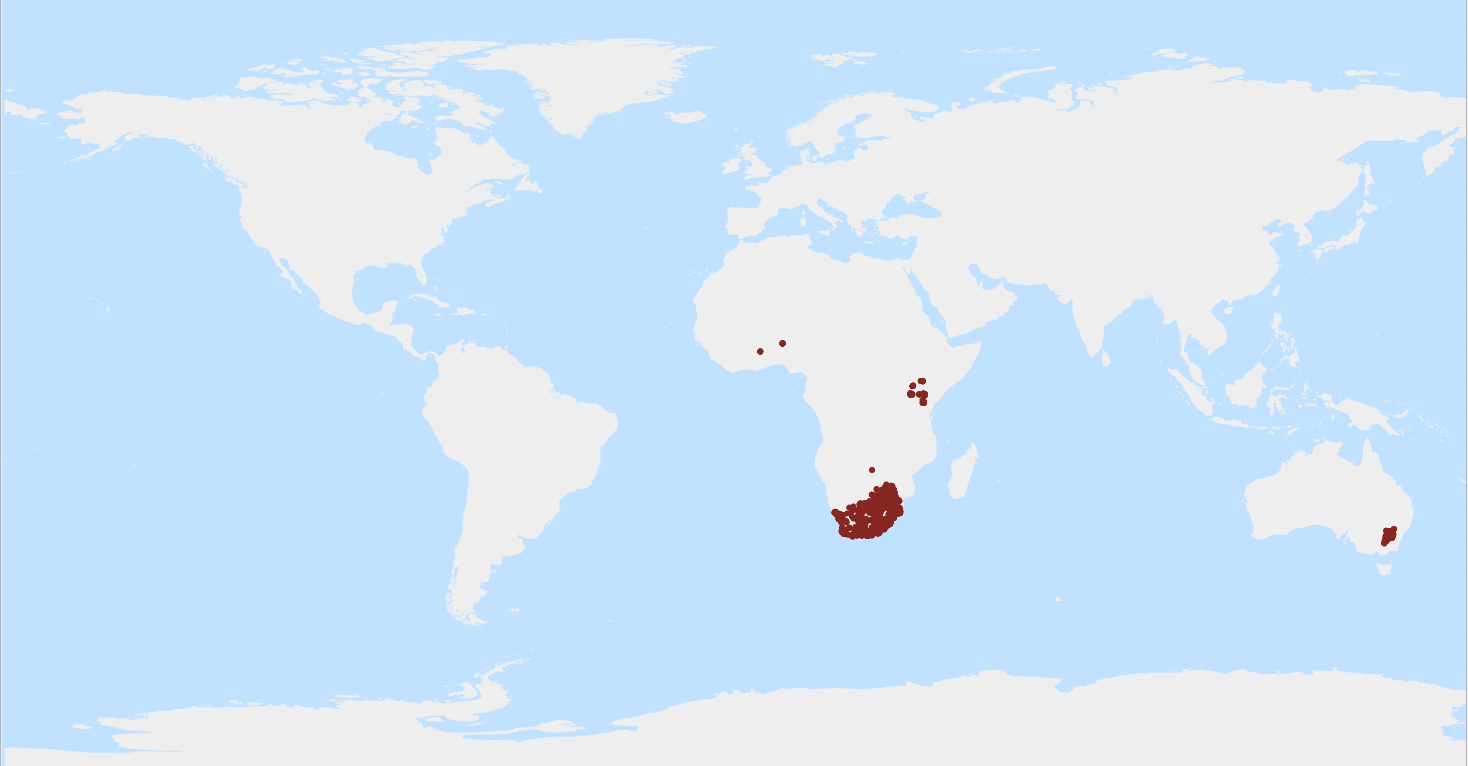
Soil moisture content by volume, at tension 500 kPa (pF 3.7) (cm³/100cm³). WoSIS_latest is a 'dynamic dataset' that contains the most recent complement of quality-assessed and standardised soil data served from WoSIS (ISRIC World Soil Information Service). The source data were shared by a wide range of data providers (see: https://www.isric.org/explore/wosis/wosis-contributing-institutions-and-experts). Being dynamic, the contents of 'wosis_latest' will change once new point data are acquired, cleansed and standardised, additional soil properties are considered, and/or when possible amendments are required. Static snapshots of 'wosis_latest' are released at irregular intervals for consistent citation purposes and to discuss methodological changes; the last snapshot is available at https://doi.org/10.5194/essd-16-4735-2024. For general information about WoSIS please see the FAQ-page at https://www.isric.org/explore/wosis/faq-wosis.