 Stars4Water
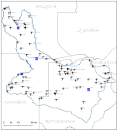
transportation
Type of resources
Available actions
Topics
Keywords
Contact for the resource
Provided by
Formats
Representation types
Update frequencies
status
Scale
Resolution
-
Airports and airstrips within the Okavango Basin. Source: Digital Chart of the World (DCW) and update vectorization from ONC charts. This dataset is part of the GIS Database for the Environment Protection and Sustainable Management of the Okavango River Basin project (EPSMO). Detailed information on the database can be found in the “GIS Database for the EPSMO Project†document produced by Luis Veríssimo (FAO consultant) in July 2009, and here available for download.
-
Roads, tracks and railroad lines within the Okavango Basin. Source: Digital Chart of the World (DCW) with partial update editing from remote sense data. This dataset is part of the GIS Database for the Environment Protection and Sustainable Management of the Okavango River Basin project (EPSMO). Detailed information on the database can be found in the “GIS Database for the EPSMO Project†document produced by Luis Veríssimo (FAO consultant) in July 2009, and here available for download.
-

The 1km raster dataset represents top location score areas filtered by exclusive criteria: access to finance, distance to major roads and access to IT (mobile broadband connection). The layer is produced under the scope of FAO’s Hand-in-Hand Initiative, Geographical Information Systems - Multicriteria Decision Analysis for value chain infrastructure location. The location score is achieved by processing sub-model outputs characterizing logistical factors for crop warehouse siting: Supply, demand, Infrastructure/accessibility. Access to finance and roads are defined using a linear distance threshold: • Banks - approx. 20 km (0.18 degree) buffer radius. • Major roads - approx. 2 km (0.018 degree) buffer radius. Access to IT is characterized applying the mobile broadband coverage map.
-

The raster dataset consists of a 1km score grid for major cereals storage location, produced under the scope of FAO’s Hand-in-Hand Initiative, Geographical Information Systems - Multicriteria Decision Analysis for value chain infrastructure location. Major cereals include barley, millet, wheat, maize, sorghum, and rice. The location score is achieved by processing sub-model outputs that characterize logistical factors for selected crop warehouse location: • Supply: Crop. • Demand: Human population density, Major cities population (national and bordering countries). • Infrastructure/accessibility: main transportation infrastructure. It consists of an arithmetic weighted sum of normalized grids (0 to 100): ("Crop Production" * 0.4) + ("Human Population Density" * 0.2) + (“Major Cities Accessibility” * 0.3) + (”Regional Cities Weighted Accessibility” *0.1 )
-

The 1km raster dataset represents top location score areas filtered by exclusive criteria: access to finance, distance to major roads and access to IT. The layer is produced under the scope of FAO’s Hand-in-Hand Initiative, Geographical Information Systems - Multicriteria Decision Analysis for value chain infrastructure location. The location score is achieved by processing sub-model outputs characterizing logistical factors for crop warehouse siting: Supply, demand, Infrastructure/accessibility. Access to finance and roads are defined using a linear distance threshold: • Banks - approx. 20 km (0.18 degree) buffer radius. • Major roads - approx. 2 km (0.018 degree) buffer radius. Access to IT is characterized applying the mobile broadband coverage map.
-

The raster dataset consists of a 1km score grid for vegetables storage location, produced under the scope of FAO’s Hand-in-Hand Initiative, Geographical Information Systems - Multicriteria Decision Analysis for value chain infrastructure location. The location score is achieved by processing sub-model outputs that characterize logistical factors for selected crop warehouse location: • Supply: Crop. • Demand: Human population density, Major cities population (national and bordering countries). • Infrastructure/accessibility: main transportation infrastructure. It consists of an arithmetic weighted sum of normalized grids (0 to 100): ("Crop Production" * 0.4) + ("Human Population Density" * 0.2) + (“Major Cities Accessibility” * 0.3) + (”Regional Cities Weighted Accessibility” *0.1 )
-

The 1km raster dataset represents top location score areas filtered by exclusive criteria: access to finance, distance to major roads and access to IT. The layer is produced under the scope of FAO’s Hand-in-Hand Initiative, Geographical Information Systems - Multicriteria Decision Analysis for value chain infrastructure location. The location score is achieved by processing sub-model outputs characterizing logistical factors for crop warehouse siting: Supply, demand, Infrastructure/accessibility. Access to finance and roads are defined using a linear distance threshold: • Banks - approx. 20 km (0.18 degree) buffer radius. • Major roads - approx. 2 km (0.018 degree) buffer radius. Access to IT is characterized applying the mobile broadband coverage map.
-

The raster dataset consists of a 1km score grid for fruits and nuts storage location, produced under the scope of FAO’s Hand-in-Hand Initiative, Geographical Information Systems - Multicriteria Decision Analysis for value chain infrastructure location. The location score is achieved by processing sub-model outputs that characterize logistical factors for selected crop warehouse location: • Supply: Crop. • Demand: Human population density, Major cities population (national and bordering countries). • Infrastructure/accessibility: main transportation infrastructure. It consists of an arithmetic weighted sum of normalized grids (0 to 100): ("Crop Production" * 0.4) + ("Human Population Density" * 0.2) + (“Major Cities Accessibility” * 0.3) + (”Regional Cities Weighted Accessibility” *0.1 )
-

The raster dataset consists of a 1km score grid for cereal storage location, produced under the scope of FAO’s Hand-in-Hand Initiative, Geographical Information Systems - Multicriteria Decision Analysis for value chain infrastructure location. The location score is achieved by processing sub-model outputs that characterize logistical factors for selected crop warehouse location: • Supply: Crop. • Demand: Human population density, Major cities population (national and bordering countries). • Infrastructure/accessibility: main transportation infrastructure. It consists of an arithmetic weighted sum of normalized grids (0 to 100): ("Crop Production" * 0.4) + ("Human Population Density" * 0.2) + (“Major Cities Accessibility” * 0.3) + (”Regional Cities Weighted Accessibility” *0.1 )
-

The 1km raster dataset represents top location score areas filtered by exclusive criteria: access to finance, distance to major roads and access to IT. The layer is produced under the scope of FAO’s Hand-in-Hand Initiative, Geographical Information Systems - Multicriteria Decision Analysis for value chain infrastructure location. The location score is achieved by processing sub-model outputs characterizing logistical factors for crop warehouse siting: Supply, demand, Infrastructure/accessibility. Access to finance and roads are defined using a linear distance threshold: • Banks - approx. 20 km (0.18 degree) buffer radius. • Major roads - approx. 2 km (0.018 degree) buffer radius. Access to IT is characterized applying the mobile broadband coverage map.