 Stars4Water
Tag_AQUASTAT
Type of resources
Available actions
Topics
Keywords
Contact for the resource
Provided by
Years
Formats
Representation types
Update frequencies
status
Scale
Resolution
-

Grid with estimated maximum available soil moisture in mm/m with a spatial resolution of 5 * 5 arc minutes. Information with regard to maximum available soil moisture was calculated from the "Derived Soil Properties" of the "Digital Soil Map of the World" which contains raster information on soil moisture in different classes.
-

GlobWat uses spatially distributed input layers consisting of monthly precipitation, number of wet days per month, coefficient of variation of precipitation, monthly reference evapotranspiration, maximum soil moisture storage capacity, maximum percolation flux, irrigated areas, land use, and areas of open water and wetlands. All these input layers are based on freely available spatial dataset with a resolution of 10 arc minutes for the climate dataset and 5 arc minutes for all the terrain and land dataset (data sources are provided in the downloadable files). The water balance is calculated in two steps. First a vertical water balance is calculated that includes rainfall dependent evapotranspiration and evapotranspiration from crops under irrigated circumstances (for which it is assumed that it can be provided by surface water or groundwater). In a second stage, a horizontal water balance is calculated to correct for incremental evapotranspiration from open water and wetlands and to calculate discharges from river (sub-) basins taking into consideration the water needed for irrigation.
-
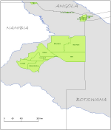
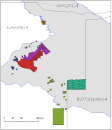
Delineation of Communal Conservancies in Namibia, that share geographical overlapping with the Okavango Basin. Source: Ministry of Agriculture, Water and Forestry of Namibia. This dataset is part of the GIS Database for the Environment Protection and Sustainable Management of the Okavango River Basin project (EPSMO). Detailed information on the database can be found in the “GIS Database for the EPSMO Project†document produced by Luis Veríssimo (FAO consultant) in July 2009, and here available for download.
-
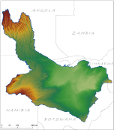
Digital Terrain Model within the Okavango Basin. Source: Data generated under the GIS EPSMO program (base:SRTM data). This dataset is part of the GIS Database for the Environment Protection and Sustainable Management of the Okavango River Basin project (EPSMO). Detailed information on the database can be found in the “GIS Database for the EPSMO Project†document produced by Luis Veríssimo (FAO consultant) in July 2009, and here available for download.
-
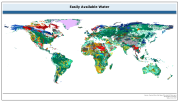
The raster dataset of easily available water has a spatial resolution of 5 * 5 arc minutes and is in geographic projection. Information with regard to available water was obtained from the "Derived Soil Properties" of the FAO-UNESCO Soil Map of the World which contains raster information on soil properties.
-
Grid with estimated reference evapotranspiration per month with a spatial resolution of 10 arc minutes. The dataset contains mean monthly values for global land areas, excluding Antarctica, for the period 1961-1990. The dataset has been prepared according to the FAO Penman - Monteith method with limited climatic data as described in FAO Irrigation and Drainage Paper 56. The dataset consists of 12 ASCII-grids with mean monthly data in mm/day * 10, and one ASCII-grid with yearly data in mm/year.
-
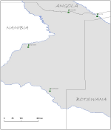
This layer represents the spatial distribution of agriculture research stations, as of 2003, in Namibia, within the Okavango Basin. Source: Ministry of Agriculture, Water and Forestry of Namibia. This dataset is part of the GIS Database for the Environment Protection and Sustainable Management of the Okavango River Basin project (EPSMO). Detailed information on the GIS Database can be found in the “GIS Database for the EPSMO Project†document produced by Luis Veríssimo (FAO consultant) in July 2009, and here available for download.
-
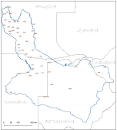
Elevation points in meters within the Okavango Basin. Source: Generated under the GIS EPSMO program, by vectorization of existing topographic maps at 1/1 000 000. This dataset is part of the GIS Database for the Environment Protection and Sustainable Management of the Okavango River Basin project (EPSMO). Detailed information on the database can be found in the “GIS Database for the EPSMO Project†document produced by Luis Veríssimo (FAO consultant) in July 2009, and here available for download.
-
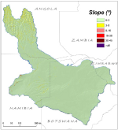
This raster layer represents the slope model within the Okavango Basin. Source: Data generated under the GIS EPSMO program (base:OB_DTM). This dataset is part of the GIS Database for the Environment Protection and Sustainable Management of the Okavango River Basin project (EPSMO). Detailed information on the database can be found in the “GIS Database for the EPSMO Project†document produced by Luis Veríssimo (FAO consultant) in July 2009, and here available for download.
-
This layer represents the spatial distribution of Government Farms, as of 2005, in Namibia, that share geographical overlapping with the Okavango Basin. Source: Ministry of Agriculture, Water and Forestry of Namibia. This dataset is part of the GIS Database for the Environment Protection and Sustainable Management of the Okavango River Basin project (EPSMO). Detailed information on the GIS Database can be found in the “GIS Database for the EPSMO Project†document produced by Luis Veríssimo (FAO consultant) in July 2009, and here available for download.