 Stars4Water
asNeeded
Type of resources
Available actions
Topics
Keywords
Contact for the resource
Provided by
Years
Formats
Representation types
Update frequencies
status
Scale
Resolution
-
As part of the the World Bank's review of its rural development strategy, the Bank sought the assistance of the Food and Agriculture Organization of the United Nations (FAO) in evaluating how farming systems might change and adapt over the next thirty years. Amongst other objectives, the World Bank asked FAO to provide guidance on priorities for investment in food security, poverty reduction, and economic growth, and in particular to identify promising approaches and technologies that will contribute to these goals. The results of the study are summarized in a set of seven documents, comprising six regional reports and the global overview contained in this volume. This document, which synthesises the results of the six regional analyses as well as discussing global trends, cross-cutting issues and possible implementation modalities, presents an overview of the complete study. This document is supplemented by two case study reports of development issues of importance to farming systems globally.
-

Derived from the Global Agro-Ecological Zones Study, Food and Agriculture Organization of the United Nations (FAO), Land and Water Development Division (AGL) with the collaboration of the International Institute for Applied Systems Analysis (IIASA), 2000. Data averaged over a period of 37 years. Raster data-set has been exported as ASCII raster file type.
-
MERIT is a merger of existing DEMs (NASA SRTM3 DEM, JAXA AW3D DEM, Viewfinder Panoramas' DEM). With error removal especially aimed at geoscience applications which are terrain-dependent. Resolution is 90m.
-
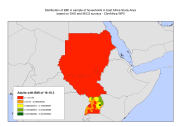
Vulnerable population identified by the nutritional status of women (BMI) as indicator for food security, in sample of households in East Africa study area. Data based on DHS and MICS surveys. In defining vulnerability, WFP (2009) and IFPRI (2012) have been followed and combined with indicators for food security with health indicators that signal vulnerability in a physical sense. IFPRI's Global Hunger Index uses three indicators to measure hunger: the number of adults being undernourished, the number of children that have low weight for age, and child mortality. Other classifications of food security use the variety of the diet as an indicator, combined with anthropometric data on children. However, in the DHS data there were no information available on child mortality, nor on dietary composition. Given these data limitations, data on nutritional status of women (Body Mass Index, BMI) for women and children (weight for age) have been used as indicators for food security. These data were combined with data on morbidity among adults and children, specifically the occurrence of malaria, cough, and diarrhea. Combinations of indicators have led to a classification of households as being very vulnerable, vulnerable, nearly vulnerable and not vulnerable. This data set was produced in the framework of the "Climate change predictions in Sub-Saharan Africa: impacts and adaptations (ClimAfrica)" project, Work Package 5 (WP5). More information on ClimAfrica project is provided in the Supplemental Information section of this metadata. This study in WP5 aimed to identify, locate and characterize groups that are vulnerable for climate change conditions in two country clusters; one in West Africa (Benin, Burkina Faso, Côte d'Ivoire, Ghana, and Togo) and one in East Africa (Sudan, South Sudan and Uganda). Data used for the study include the Demographic and Health Surveys (DHS) , the Multi Indicator Cluster Survey (MICS) and the Afrobarometer surveys for the socio-economic variables and grid level data on agro-ecological and climatic conditions.
-
Dynamic World is a 10m near-real-time (NRT) Land Use/Land Cover (LULC) dataset that includes class probabilities and label information for nine classes. Predictions are available from 2015-06-27 to present.
-
Soil moisture derived from the Backus-Gilbert interpolated radiometer brightness temperature measurements, posted at 9 km.
-
This is the original PCR-GLOBWB simulation data that was used to derive the results for the Human water consumption intensifies hydrological drought worldwide paper by Wada, van Beek, Wanders and Bierkens in Environmental Research Letters. (2018-04-17)
-
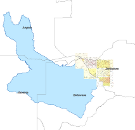
A set of 6 medium scale (250k) topographic maps, that share geographical overlapping with the Okavango Basin. Source: The Surveyor General, Harare, Zimbabwe. Original data georeferenced under the GIS EPSMO program. This dataset is part of the GIS Database for the Environment Protection and Sustainable Management of the Okavango River Basin project (EPSMO). Detailed information on the database can be found in the “GIS Database for the EPSMO Project†document produced by Luis Veríssimo (FAO consultant) in July 2009, and here available for download.
-

The “malnourishment index” relates to the degree of food insecurity of a certain region in 2010. A community characterized by scarce food quality supply and thus subject to malnutrition and starvation of large part of its members is prone to suffer from climate change impact on food production. The index results from the second cluster of the Principal Component Analysis preformed among 14 potential variables. The analysis identify four dominant variables, namely “percentage of underweighted children”, “percentage of stunted children”, “diet diversification index” and “animal protein supply”, assigning a weight of 0.25 to the “percentage of underweighted children” and the “percentage of stunted children”, 0.3 to the “animal protein supply” and 0.2 to the “diet diversification index”. Before to perform the analysis the variables were score-standardized (converted to distribution with average of 0 and standard deviation of 1; “diet diversification index” and “animal protein supply” with inverse method) in order to be comparable. The first administrative level data for “percentage of underweighted children” (more than two standard deviations below the mean weight-for-age score of the NCHS/CDC/WHO international reference population) and “percentage of stunted children” (more than two standard deviations below the mean height-for-age score of the NCHS/CDC/WHO international reference population) were derived from the Global Database on Child Growth and Malnutrition of WHO/UNICEF (data range from 1998 to 2012). When subnational data were not available, were used the national values from UNICEF database. Such national figures were used also to normalize to 2010 the values recorded by WHO/UNICEF. Tabular data were linked by first administrative unit to the first administrative boundaries shapefile (FAO/GAUL) and then converted into raster format (resolution 0.5 arc-minute). The country based values for the other two variables were collected from FAO statistics like the average of the period 2008-2012. Tabular data were linked by country to the national boundaries shapefile (FAO/GAUL) and then converted into raster format (resolution 0.5 arc-minute). Malnourishment illustrates the problems of food insecurity and hunger of a population, which has serious consequences on people's physical condition and very negative impacts on the mental and physical development of children. Countries which have worst diet parameters are more sensitive to the effects of the climate change. Indeed low animal protein consumption and low diet diversification (dominated by cereals) are indicators of the lack of alternative food source than local cereals production. This dataset has been produced in the framework of the “Climate change predictions in Sub-Saharan Africa: impacts and adaptations (ClimAfrica)” project, Work Package 4 (WP4). More information on ClimAfrica project is provided in the Supplemental Information section of this metadata.
-
The International Hydrogeological Map of Europe 1:1,500,000 constitutes the only coherent general map of groundwater resources throughout Europe. Groundwater is distinguished according to productivity, aquifer rock type (porous or fissured rocks) and lithology of water-bearing strata. Moreover the map series includes the position of relevant tectonic fractures.