 Stars4Water
notPlanned
Type of resources
Available actions
Topics
Keywords
Contact for the resource
Provided by
Years
Formats
Representation types
Update frequencies
status
Scale
Resolution
-

The 1km raster dataset represents top location score areas filtered by exclusive criteria: access to finance, distance to major roads and access to IT (mobile broadband connection). The layer is produced under the scope of FAO’s Hand-in-Hand Initiative, Geographical Information Systems - Multicriteria Decision Analysis for value chain infrastructure location. The location score is achieved by processing sub-model outputs characterizing logistical factors for crop warehouse siting: Supply, demand, Infrastructure/accessibility. Access to finance and roads are defined using a linear distance threshold: • Banks - approx. 20 km (0.18 degree) buffer radius. • Major roads - approx. 2 km (0.018 degree) buffer radius. Access to IT is characterized applying the mobile broadband coverage map.
-

The raster dataset consists of a 1km score grid for major cereals storage location, produced under the scope of FAO’s Hand-in-Hand Initiative, Geographical Information Systems - Multicriteria Decision Analysis for value chain infrastructure location. Major cereals include barley, millet, wheat, maize, sorghum, and rice. The location score is achieved by processing sub-model outputs that characterize logistical factors for selected crop warehouse location: • Supply: Crop. • Demand: Human population density, Major cities population (national and bordering countries). • Infrastructure/accessibility: main transportation infrastructure. It consists of an arithmetic weighted sum of normalized grids (0 to 100): ("Crop Production" * 0.4) + ("Human Population Density" * 0.2) + (“Major Cities Accessibility” * 0.3) + (”Regional Cities Weighted Accessibility” *0.1 )
-

The 1km raster dataset represents top location score areas filtered by exclusive criteria: access to finance, distance to major roads and access to IT. The layer is produced under the scope of FAO’s Hand-in-Hand Initiative, Geographical Information Systems - Multicriteria Decision Analysis for value chain infrastructure location. The location score is achieved by processing sub-model outputs characterizing logistical factors for crop warehouse siting: Supply, demand, Infrastructure/accessibility. Access to finance and roads are defined using a linear distance threshold: • Banks - approx. 20 km (0.18 degree) buffer radius. • Major roads - approx. 2 km (0.018 degree) buffer radius. Access to IT is characterized applying the mobile broadband coverage map.
-

The raster dataset consists of a 1km score grid for vegetables storage location, produced under the scope of FAO’s Hand-in-Hand Initiative, Geographical Information Systems - Multicriteria Decision Analysis for value chain infrastructure location. The location score is achieved by processing sub-model outputs that characterize logistical factors for selected crop warehouse location: • Supply: Crop. • Demand: Human population density, Major cities population (national and bordering countries). • Infrastructure/accessibility: main transportation infrastructure. It consists of an arithmetic weighted sum of normalized grids (0 to 100): ("Crop Production" * 0.4) + ("Human Population Density" * 0.2) + (“Major Cities Accessibility” * 0.3) + (”Regional Cities Weighted Accessibility” *0.1 )
-
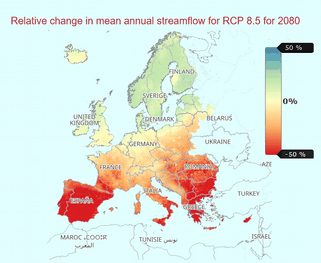
The dataset provides a number of indicators of the potential change, relative to a reference period of the recent past, in hydrological conditions over the 21st Century based on an ensemble of climate and hydrological models. The indicators cover hydrological variables of river discharge, soil moisture, snow water equivalent and groundwater recharge. These indicators are produced by various hydrological models using input variables of historical and projected precipitation, temperature and potential evapotranspiration. The indicators transform data from climate projections into usable information for the European water sector. They were defined in discussion with stakeholder groups working in different areas of the water sector (hydropower, irrigation, water supply) to provide clear information on climate projections for water resources as annual, seasonal and monthly change factors for a range of variables. A range of global climate models and standard projection scenarios (based on latest Copernicus Climate Change Service and Coupled Model Inter-comparison Project Phase 5 climate modelling experiments) were used along a multi-hydrological model approach to produce these indicators. This ensemble approach to the climate and hydrological modelling captures the uncertainty and variability of the hydrological regime. Precipitation and temperature data from five global climate models was downscaled to 5km x 5km resolution with the daily values disaggregated to 3-hourly values. These data were used to force four hydrological models to produce the hydrological variables to derive the indicators. The indicators are given as relative changes for a given 30-year projection window with respect to the reference period estimates of 1971-2010 for Representative Concentration Pathways (RCP) 2.6 and 8.5, for each grid cell. This dataset is produced on behalf of Copernicus Climate Change Service, by UK Centre for Ecology & Hydrology (UKCEH), Helmholtz Centre for Environmental Research (UFZ), Leipzig, Centro Tecnológico del Agua (Cetaqua), Climate Partnership LLC (CPL), Environment Agency (EA), Mediterranean Network of Basin Organisations (MENBO), Norwegian Water Resources & Energy Directorate (NVE).
-
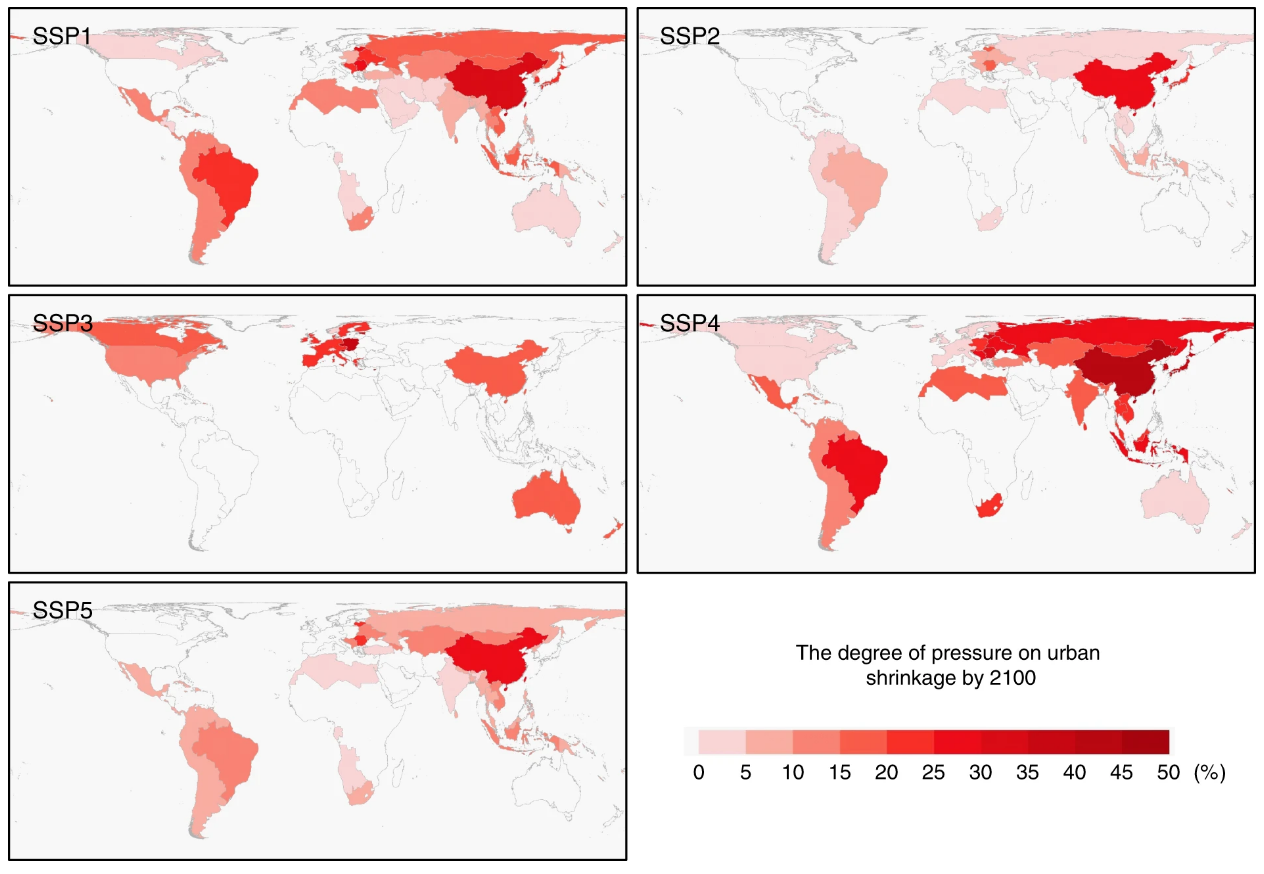
Dataset with article https://www.nature.com/articles/s41467-020-14386-x (https://doi.org/10.1038/s41467-020-14386-x). Despite its small land coverage, urban land and its expansion can have profound impacts on global environments. Therefore, a proper understanding of how future urban land change will affect other land covers is important to alleviate the social and environmental problems that challenge the sustainable developments of human societies. Recently, The Shared Socioeconomic Pathways (SSPs) were adopted by the Coupled Model Intercomparison Project Phase 6 (CMIP6), enabling researchers to conduct unified, comparable multi-scenario simulations and integrate such simulation products into climate change research. The SSPs focus on the key socio-economic factors including demographic dynamics, economic development, technological change, social, cultural, and institutional changes and policies. Here, we present the scenario projections of global urban land expansion under the framework of the shared socioeconomic pathways (SSPs) every 10 years from 2015 to 2100. Our projections feature a fine spatial resolution of 1 km that preserves spatial details and avoids potential distortions in urban land patterns. The objective is to enable the assessment of different scenarios of future urban expansion and their related impacts on a global scale under the latest recognized SSP scenarios.
-

The 1km raster dataset represents top location score areas filtered by exclusive criteria: access to finance, distance to major roads and access to IT. The layer is produced under the scope of FAO’s Hand-in-Hand Initiative, Geographical Information Systems - Multicriteria Decision Analysis for value chain infrastructure location. The location score is achieved by processing sub-model outputs characterizing logistical factors for crop warehouse siting: Supply, demand, Infrastructure/accessibility. Access to finance and roads are defined using a linear distance threshold: • Banks - approx. 20 km (0.18 degree) buffer radius. • Major roads - approx. 2 km (0.018 degree) buffer radius. Access to IT is characterized applying the mobile broadband coverage map.
-

The raster dataset consists of a 1km score grid for fruits and nuts storage location, produced under the scope of FAO’s Hand-in-Hand Initiative, Geographical Information Systems - Multicriteria Decision Analysis for value chain infrastructure location. The location score is achieved by processing sub-model outputs that characterize logistical factors for selected crop warehouse location: • Supply: Crop. • Demand: Human population density, Major cities population (national and bordering countries). • Infrastructure/accessibility: main transportation infrastructure. It consists of an arithmetic weighted sum of normalized grids (0 to 100): ("Crop Production" * 0.4) + ("Human Population Density" * 0.2) + (“Major Cities Accessibility” * 0.3) + (”Regional Cities Weighted Accessibility” *0.1 )
-
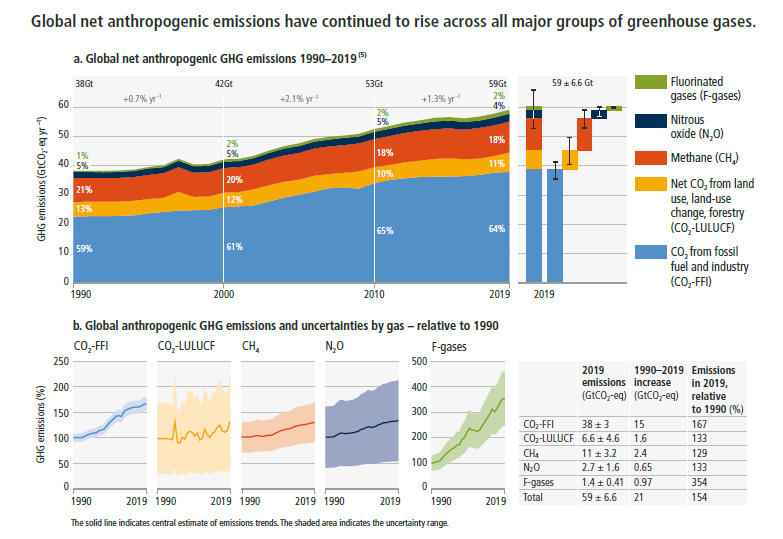
As part of the IPCC's Sixth Assessment Report (AR6), authors from Working Group III on Mitigation of Climate Change undertook a comprehensive exercise to collect and assess quantitative, model-based scenarios related to the mitigation of climate change. Building on previous assessments, such as those undertaken for the Fifth Assessment Report (AR5) and the Special Report on Global Warming of 1.5°C (SR15), the calls for scenarios in AR6 have been expanded to include energy, emissions, and sectoral scenarios from global to national scales, thus more broadly supporting the assessment across multiple chapters (see Annex III, Part 2 of the WG III Report and the About tab for more details). The compilation and assessment of the scenario ensemble was conducted by authors of the IPCC AR6 report, and the resource is hosted by the International Institute for Applied Systems Analysis (IIASA) as part of a cooperation agreement with Working Group III of the IPCC. The scenario ensemble contains 3,131 quantitative scenarios with data on socio-economic development, greenhouse gas emissions, and sectoral transformations across energy, land use, transportation and industry. These scenarios derive from 188 unique modelling frameworks and 95+ model families that are either globally comprehensive, national, multi-regional or sectoral. The criteria for submission included that the scenario is presented in a peer-reviewed journal accepted for publication no later than October 11th, 2021, or published in a report determined by the IPCC to be eligible grey literature by the same date.
-

The combination of yield gap and poverty rates into a single map enables to identify best feasible modalities for agricultural development, potential investment, and resource allocation. - Yield gap provides important information for identifying causes of food insecurity and addressing rural poverty. Yield and production gaps have been estimated by comparing at a spatially detailed level of 5 arc-minutes the agro-ecological attainable yield and production of 22 major crops/crop groups, simulated under the historical climate of 1981-2010, with actual yields and production obtained by downscaling for the years 2000 and 2010 statistical data of main food, feed, and fiber crops. - The poverty map portrays poverty rates at the country level. Accordingly, the higher percentage of poverty in a particular area, the poorer population is located there.