 Stars4Water
habitat
Type of resources
Available actions
Topics
Keywords
Contact for the resource
Provided by
Years
Representation types
Update frequencies
status
Resolution
-
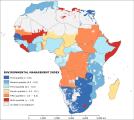
The “environmental management index” symbolize the impacts of institutional management on ecosystem and thus the ability of state institution to enhance the resilience to environmental and climate change in 2010. Institution able to manage efficiently the biodiversity and habitat conservation and to administer water related problems may have the capacity to face the impact of climate change on agriculture and water resources. Moreover ecosystem diversity and conservation is an indicator of environmental health, which maintains environmental services and natural balance among species. These ecological qualities are useful for communities when trying to keep or improve adaptation processes. The index results from the third cluster of the Principal Component Analysis preformed among 18 potential variables. The analysis identifies two dominant variables, namely “habitat and biodiversity management” and “water management”, assigning weights of 0.6 and 0.4, respectively. Before to perform the analysis the variables were log transformed to shorten the extreme variation and then were score-standardized (converted to distribution with average of 0 and standard deviation of 1) in order to be comparable. The country based values of the two variables were obtained from sub-indicators of the Environmental Performance Index (EPI) developed by Yale University. The “habitat and biodiversity management” includes four indicators: Critical Habitat Protection, Terrestrial Protected Areas (National Biome Weight), Terrestrial Protected Areas (Global Biome Weight), and Marine Protected Areas, whereas the “water management” include the only Wastewater treatment indicator. The data represents the averaged value for the period 2008-2012. EPI indicators use a “proximity-to-target” methodology, which assesses how close a particular country is to an identified policy target. Thus, scores are on a scale of 0 to 100 by simple arithmetic calculation, with 0 being the farthest from the target and 100 being closest to the target. This dataset has been produced in the framework of the “Climate change predictions in Sub-Saharan Africa: impacts and adaptations (ClimAfrica)” project, Work Package 4 (WP4). More information on ClimAfrica project is provided in the Supplemental Information section of this metadata.