 Stars4Water
Africa
Type of resources
Available actions
Topics
Keywords
Contact for the resource
Provided by
Years
Formats
Representation types
Update frequencies
status
Scale
Resolution
-
As part of the the World Bank's review of its rural development strategy, the Bank sought the assistance of the Food and Agriculture Organization of the United Nations (FAO) in evaluating how farming systems might change and adapt over the next thirty years. Amongst other objectives, the World Bank asked FAO to provide guidance on priorities for investment in food security, poverty reduction, and economic growth, and in particular to identify promising approaches and technologies that will contribute to these goals. The results of the study are summarized in a set of seven documents, comprising six regional reports and the global overview contained in this volume. This document, which synthesises the results of the six regional analyses as well as discussing global trends, cross-cutting issues and possible implementation modalities, presents an overview of the complete study. This document is supplemented by two case study reports of development issues of importance to farming systems globally.
-
Derived from the Global Agro-Ecological Zones Study, Food and Agriculture Organization of the United Nations (FAO), Land and Water Development Division (AGL) with the collaboration of the International Institute for Applied Systems Analysis (IIASA), 2000. Data averaged over a period of 37 years. Raster data-set has been exported as ASCII raster file type.
-
As part of the the World Bank's review of its rural development strategy, the Bank sought the assistance of the Food and Agriculture Organization of the United Nations (FAO) in evaluating how farming systems might change and adapt over the next thirty years. Amongst other objectives, the World Bank asked FAO to provide guidance on priorities for investment in food security, poverty reduction, and economic growth, and in particular to identify promising approaches and technologies that will contribute to these goals. The results of the study are summarized in a set of seven documents, comprising six regional reports and the global overview contained in this volume. This document, which synthesises the results of the six regional analyses as well as discussing global trends, cross-cutting issues and possible implementation modalities, presents an overview of the complete study. This document is supplemented by two case study reports of development issues of importance to farming systems globally.
-
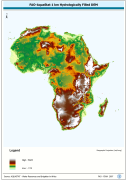
WRIA_DEM: Hydrologically filled GTopo30 DEM with the main stems of cartographic rivers "burned-in" for irrigation analysis. GT30/GTopo30 is Global Topographic 30 arc second DEM database, nominal 1km postings; DEM is Digital Elevation Model. The WRIALAEA grid data layer is comprised of 9194x8736 derivative raster hydrologically filled dem features derived based on 1 kilometer data originally from FAO.
-
As part of the the World Bank's review of its rural development strategy, the Bank sought the assistance of the Food and Agriculture Organization of the United Nations (FAO) in evaluating how farming systems might change and adapt over the next thirty years. Amongst other objectives, the World Bank asked FAO to provide guidance on priorities for investment in food security, poverty reduction, and economic growth, and in particular to identify promising approaches and technologies that will contribute to these goals. The results of the study are summarized in a set of seven documents, comprising six regional reports and the global overview contained in this volume. This document, which synthesises the results of the six regional analyses as well as discussing global trends, cross-cutting issues and possible implementation modalities, presents an overview of the complete study. This document is supplemented by two case study reports of development issues of importance to farming systems globally.
-

The “malnourishment index” relates to the degree of food insecurity of a certain region in 2010. A community characterized by scarce food quality supply and thus subject to malnutrition and starvation of large part of its members is prone to suffer from climate change impact on food production. The index results from the second cluster of the Principal Component Analysis preformed among 14 potential variables. The analysis identify four dominant variables, namely “percentage of underweighted children”, “percentage of stunted children”, “diet diversification index” and “animal protein supply”, assigning a weight of 0.25 to the “percentage of underweighted children” and the “percentage of stunted children”, 0.3 to the “animal protein supply” and 0.2 to the “diet diversification index”. Before to perform the analysis the variables were score-standardized (converted to distribution with average of 0 and standard deviation of 1; “diet diversification index” and “animal protein supply” with inverse method) in order to be comparable. The first administrative level data for “percentage of underweighted children” (more than two standard deviations below the mean weight-for-age score of the NCHS/CDC/WHO international reference population) and “percentage of stunted children” (more than two standard deviations below the mean height-for-age score of the NCHS/CDC/WHO international reference population) were derived from the Global Database on Child Growth and Malnutrition of WHO/UNICEF (data range from 1998 to 2012). When subnational data were not available, were used the national values from UNICEF database. Such national figures were used also to normalize to 2010 the values recorded by WHO/UNICEF. Tabular data were linked by first administrative unit to the first administrative boundaries shapefile (FAO/GAUL) and then converted into raster format (resolution 0.5 arc-minute). The country based values for the other two variables were collected from FAO statistics like the average of the period 2008-2012. Tabular data were linked by country to the national boundaries shapefile (FAO/GAUL) and then converted into raster format (resolution 0.5 arc-minute). Malnourishment illustrates the problems of food insecurity and hunger of a population, which has serious consequences on people's physical condition and very negative impacts on the mental and physical development of children. Countries which have worst diet parameters are more sensitive to the effects of the climate change. Indeed low animal protein consumption and low diet diversification (dominated by cereals) are indicators of the lack of alternative food source than local cereals production. This dataset has been produced in the framework of the “Climate change predictions in Sub-Saharan Africa: impacts and adaptations (ClimAfrica)” project, Work Package 4 (WP4). More information on ClimAfrica project is provided in the Supplemental Information section of this metadata.
-
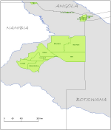
Delineation of Communal Conservancies in Namibia, that share geographical overlapping with the Okavango Basin. Source: Ministry of Agriculture, Water and Forestry of Namibia. This dataset is part of the GIS Database for the Environment Protection and Sustainable Management of the Okavango River Basin project (EPSMO). Detailed information on the database can be found in the “GIS Database for the EPSMO Project†document produced by Luis Veríssimo (FAO consultant) in July 2009, and here available for download.
-
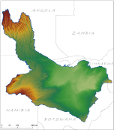
Digital Terrain Model within the Okavango Basin. Source: Data generated under the GIS EPSMO program (base:SRTM data). This dataset is part of the GIS Database for the Environment Protection and Sustainable Management of the Okavango River Basin project (EPSMO). Detailed information on the database can be found in the “GIS Database for the EPSMO Project†document produced by Luis Veríssimo (FAO consultant) in July 2009, and here available for download.
-
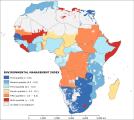
The “environmental management index” symbolize the impacts of institutional management on ecosystem and thus the ability of state institution to enhance the resilience to environmental and climate change in 2010. Institution able to manage efficiently the biodiversity and habitat conservation and to administer water related problems may have the capacity to face the impact of climate change on agriculture and water resources. Moreover ecosystem diversity and conservation is an indicator of environmental health, which maintains environmental services and natural balance among species. These ecological qualities are useful for communities when trying to keep or improve adaptation processes. The index results from the third cluster of the Principal Component Analysis preformed among 18 potential variables. The analysis identifies two dominant variables, namely “habitat and biodiversity management” and “water management”, assigning weights of 0.6 and 0.4, respectively. Before to perform the analysis the variables were log transformed to shorten the extreme variation and then were score-standardized (converted to distribution with average of 0 and standard deviation of 1) in order to be comparable. The country based values of the two variables were obtained from sub-indicators of the Environmental Performance Index (EPI) developed by Yale University. The “habitat and biodiversity management” includes four indicators: Critical Habitat Protection, Terrestrial Protected Areas (National Biome Weight), Terrestrial Protected Areas (Global Biome Weight), and Marine Protected Areas, whereas the “water management” include the only Wastewater treatment indicator. The data represents the averaged value for the period 2008-2012. EPI indicators use a “proximity-to-target” methodology, which assesses how close a particular country is to an identified policy target. Thus, scores are on a scale of 0 to 100 by simple arithmetic calculation, with 0 being the farthest from the target and 100 being closest to the target. This dataset has been produced in the framework of the “Climate change predictions in Sub-Saharan Africa: impacts and adaptations (ClimAfrica)” project, Work Package 4 (WP4). More information on ClimAfrica project is provided in the Supplemental Information section of this metadata.