 Stars4Water
society
Type of resources
Available actions
Topics
Keywords
Contact for the resource
Provided by
Years
Formats
Representation types
Update frequencies
status
Scale
Resolution
-

The “malnourishment index” relates to the degree of food insecurity of a certain region in 2010. A community characterized by scarce food quality supply and thus subject to malnutrition and starvation of large part of its members is prone to suffer from climate change impact on food production. The index results from the second cluster of the Principal Component Analysis preformed among 14 potential variables. The analysis identify four dominant variables, namely “percentage of underweighted children”, “percentage of stunted children”, “diet diversification index” and “animal protein supply”, assigning a weight of 0.25 to the “percentage of underweighted children” and the “percentage of stunted children”, 0.3 to the “animal protein supply” and 0.2 to the “diet diversification index”. Before to perform the analysis the variables were score-standardized (converted to distribution with average of 0 and standard deviation of 1; “diet diversification index” and “animal protein supply” with inverse method) in order to be comparable. The first administrative level data for “percentage of underweighted children” (more than two standard deviations below the mean weight-for-age score of the NCHS/CDC/WHO international reference population) and “percentage of stunted children” (more than two standard deviations below the mean height-for-age score of the NCHS/CDC/WHO international reference population) were derived from the Global Database on Child Growth and Malnutrition of WHO/UNICEF (data range from 1998 to 2012). When subnational data were not available, were used the national values from UNICEF database. Such national figures were used also to normalize to 2010 the values recorded by WHO/UNICEF. Tabular data were linked by first administrative unit to the first administrative boundaries shapefile (FAO/GAUL) and then converted into raster format (resolution 0.5 arc-minute). The country based values for the other two variables were collected from FAO statistics like the average of the period 2008-2012. Tabular data were linked by country to the national boundaries shapefile (FAO/GAUL) and then converted into raster format (resolution 0.5 arc-minute). Malnourishment illustrates the problems of food insecurity and hunger of a population, which has serious consequences on people's physical condition and very negative impacts on the mental and physical development of children. Countries which have worst diet parameters are more sensitive to the effects of the climate change. Indeed low animal protein consumption and low diet diversification (dominated by cereals) are indicators of the lack of alternative food source than local cereals production. This dataset has been produced in the framework of the “Climate change predictions in Sub-Saharan Africa: impacts and adaptations (ClimAfrica)” project, Work Package 4 (WP4). More information on ClimAfrica project is provided in the Supplemental Information section of this metadata.
-
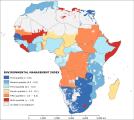
The “environmental management index” symbolize the impacts of institutional management on ecosystem and thus the ability of state institution to enhance the resilience to environmental and climate change in 2010. Institution able to manage efficiently the biodiversity and habitat conservation and to administer water related problems may have the capacity to face the impact of climate change on agriculture and water resources. Moreover ecosystem diversity and conservation is an indicator of environmental health, which maintains environmental services and natural balance among species. These ecological qualities are useful for communities when trying to keep or improve adaptation processes. The index results from the third cluster of the Principal Component Analysis preformed among 18 potential variables. The analysis identifies two dominant variables, namely “habitat and biodiversity management” and “water management”, assigning weights of 0.6 and 0.4, respectively. Before to perform the analysis the variables were log transformed to shorten the extreme variation and then were score-standardized (converted to distribution with average of 0 and standard deviation of 1) in order to be comparable. The country based values of the two variables were obtained from sub-indicators of the Environmental Performance Index (EPI) developed by Yale University. The “habitat and biodiversity management” includes four indicators: Critical Habitat Protection, Terrestrial Protected Areas (National Biome Weight), Terrestrial Protected Areas (Global Biome Weight), and Marine Protected Areas, whereas the “water management” include the only Wastewater treatment indicator. The data represents the averaged value for the period 2008-2012. EPI indicators use a “proximity-to-target” methodology, which assesses how close a particular country is to an identified policy target. Thus, scores are on a scale of 0 to 100 by simple arithmetic calculation, with 0 being the farthest from the target and 100 being closest to the target. This dataset has been produced in the framework of the “Climate change predictions in Sub-Saharan Africa: impacts and adaptations (ClimAfrica)” project, Work Package 4 (WP4). More information on ClimAfrica project is provided in the Supplemental Information section of this metadata.
-
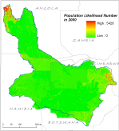
Population database compiled on a 30x30†lat/long grid, for the years: 1998, 2000 and 2007. within the Okavango Basin. Census counts (at sub-national level) were apportioned to each grid cell based on likelihood coefficients, which are based on proximity to roads, slope, land cover, nighttime lights, and other information.Source: Oak Ridge National Laboratory (ORNL). This dataset is part of the GIS Database for the Environment Protection and Sustainable Management of the Okavango River Basin project (EPSMO). Detailed information on the database can be found in the “GIS Database for the EPSMO Project†document produced by Luis Veríssimo (FAO consultant) in July 2009, and here available for download.
-

The “richness index” represents the level of economical wellbeing a country certain area in 2010. Regions with higher income per capita and low poverty rate and more access to market are wealthier and are therefore better able to prepare for and respond to adversity. The index results from the second cluster of the Principal Component Analysis preformed among 9 potential variables. The analysis identifies four dominant variables, namely “GDPppp per capita”, “agriculture share GDP per agriculture sector worker”, “poverty rate” and “market accessibility”, assigning weights of 0.33, 0.26, 0.25 and 0.16, respectively. Before to perform the analysis all variables were log transformed (except the “agriculture share GDP per agriculture sector worker”) to shorten the extreme variation and then were score-standardized (converted to distribution with average of 0 and standard deviation of 1; inverse method was applied for the “poverty rate” and “market accessibility”) in order to be comparable. The 0.5 arc-minute grid total GDPppp is based on the night time light satellite imagery of NOAA (see Ghosh, T., Powell, R., Elvidge, C. D., Baugh, K. E., Sutton, P. C., & Anderson, S. (2010).Shedding light on the global distribution of economic activity. The Open Geography Journal (3), 148-161) and adjusted to national total as recorded by International Monetary Fund for 2010. The “GDPppp per capita” was calculated dividing the total GDPppp by the population in each pixel. Further, a focal statistic ran to determine mean values within 10 km. This had a smoothing effect and represents some of the extended influence of intense economic activity for the local people. Country based data for “agriculture share GDP per agriculture sector worker” were calculated from GDPppp (data from International Monetary Fund) fraction from agriculture activity (measured by World Bank) divided by the number of worker in the agriculture sector (data from World Bank). The tabular data represents the average of the period 2008-2012 and were linked by country unit to the national boundaries shapefile (FAO/GAUL) and then converted into raster format (resolution 0.5 arc-minute). The first administrative level data for the “poverty rate” were estimated by NOAA for 2003 using nighttime lights satellite imagery. Tabular data were linked by first administrative unit to the first administrative boundaries shapefile (FAO/GAUL) and then converted into raster format (resolution 0.5 arc-minute). The 0.5 arc-minute grid “market accessibility” measures the travel distance in minutes to large cities (with population greater than 50,000 people). This dataset was developed by the European Commission and the World Bank to represent access to markets, schools, hospitals, etc.. The dataset capture the connectivity and the concentration of economic activity (in 2000). Markets may be important for a variety of reasons, including their abilities to spread risk and increase incomes. Markets are a means of linking people both spatially and over time. That is, they allow shocks (and risks) to be spread over wider areas. In particular, markets should make households less vulnerable to (localized) covariate shocks. This dataset has been produced in the framework of the “Climate change predictions in Sub-Saharan Africa: impacts and adaptations (ClimAfrica)” project, Work Package 4 (WP4). More information on ClimAfrica project is provided in the Supplemental Information section of this metadata.
-
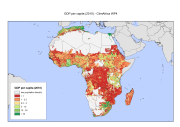
The Gross Domestic Product per capita (gross domestic product divided by mid-year population converted to international dollars, using purchasing power parity rates) has been identified as an important determinant of susceptibility and vulnerability by different authors and used in the Disaster Risk Index 2004 (Peduzzi et al. 2009, Schneiderbauer 2007, UNDP 2004) and is commonly used as an indicator for a country’s economic development (e.g. Human Development Index). Despite some criticisms (Brooks et al. 2005) it is still considered useful to estimate a population’s susceptibility to harm, as limited monetary resources are seen as an important factor of vulnerability. However, collection of data on economic variables, especially sub-national income levels, is problematic, due to various shortcomings in the data collection process. Additionally, the informal economy is often excluded from official statistics. Night time lights satellite imagery of NOAA grid provides an alternative means for measuring economic activity. NOAA scientists developed a model for creating a world map of estimated total (formal plus informal) economic activity. Regression models were developed to calibrate the sum of lights to official measures of economic activity at the sub-national level for some target Country and at the national level for other countries of the world, and subsequently regression coefficients were derived. Multiplying the regression coefficients with the sum of lights provided estimates of total economic activity, which were spatially distributed to generate a 30 arc-second map of total economic activity (see Ghosh, T., Powell, R., Elvidge, C. D., Baugh, K. E., Sutton, P. C., & Anderson, S. (2010).Shedding light on the global distribution of economic activity. The Open Geography Journal (3), 148-161). We adjusted the GDP to the total national GDPppp amount as recorded by IMF (International Monetary Fund) for 2010 and we divided it by the population layer from Worldpop Project. Further, we ran a focal statistics analysis to determine mean values within 10 cell (5 arc-minute, about 10 Km) of each grid cell. This had a smoothing effect and represents some of the extended influence of intense economic activity for local people. Finally we apply a mask to remove the area with population below 1 people per square Km. This dataset has been produced in the framework of the "Climate change predictions in Sub-Saharan Africa: impacts and adaptations (ClimAfrica)" project, Work Package 4 (WP4). More information on ClimAfrica project is provided in the Supplemental Information section of this metadata.
-
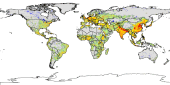
The Food and Agriculture Organization of the United Nations (FAO) with the collaboration of the International Institute for Applied Systems Analysis (IIASA), has developed a system that enables rational land-use planning on the basis of an inventory of land resources and evaluation of biophysical limitations and potentials. This is referred to as the Agro-ecological Zones (AEZ) methodology.
-

The “element at risk index” describes the distribution in 2010 of the density of element (i.e. people, livestock unit or crop land) that are potentially threaded by climatic stress. When a climatic stress impact a densely populated (in terms of element at risk) the impact is likely to be more severe than it would be in areas with fewer element. The index results from the second cluster of the Principal Component Analysis (PCA) performed among potential 10 variables. The analysis identify three dominant variables, namely “people”, “livestock unit” and “crop land”, assigning a weight of 0.3 to people and weights of 0.35 to the other two variables. Before to perform the analysis the variables were log transformed to shorten the extreme variation and then score-standardized (converted to distribution with average of 0 and standard deviation of 1) in order to be comparable. The 0.5 arc-minute grid of population distribution in 2010 were gathered from Worldpop project website. The methodological approach used by Worldpop Project is described in Tatem et al 2007 (DOI: 10.1371/journal.pone.0001298). The values were adjusted in order to have national population totals equal to the UN Population and Demographic Office estimation per Country (World Population Prospect - the 2012 Revision). The 3 arc-minute grid of livestock distribution were gathered from FAO GeoNetwork (cattle, sheep, goats, pigs and poultry distribution), sampled at 0.5 arc-minute. The values were adjusted to national total livestock abundance in 2010 (FAO stats). The single species abundances were converted to livestock unit (LSU) according FAO methodology. The 0.5 arc-minute grid of crop land distribution were collected from FAO Global Land Cover-SHARE of 2014. The area with less than 1 people and 1 LSU for cell (about 1 Km square) and without cropland were masked and removed from the analysis for all layer because considered not exposed to climatic stress. This dataset has been produced in the framework of the “Climate change predictions in Sub-Saharan Africa: impacts and adaptations (ClimAfrica)” project, Work Package 4 (WP4). More information on ClimAfrica project is provided in the Supplemental Information section of this metadata.
-

The “governance index” is related to potential effectiveness of any governmental response during and after exposure to climate stress in 2010. Generally well-structured governmental institutions are able to enhance the resilience of its members and citizen promoting adaptation strategies and action. The index results from the first cluster of the Principal Component Analysis preformed among 18 potential variables. The analysis identifies seven dominant variables, namely “openness to external assistance”, “regulatory quality”, “government effectiveness”, “voice and accountability”, “failed state”, “perceived corruption” and “criminal rate”, assigning equal weight of 0.1525 except to “criminal rate” that retrieve a weight of 0.085. Before to perform the analysis “criminal rate” was log transformed to shorten the extreme variation and then all variables were score-standardized (converted to distribution with average of 0 and standard deviation of 1; inverse method was applied for “criminal rate”) in order to be comparable. All the variables are country base and the tabular data were linked by country to the national boundaries shapefile (FAO/GAUL) and then converted into raster format (resolution 0.5 arc-minute). The variable “openness to external assistance” was compute as the average values of the period 2008-2012 of the KOF Index of Globalization that serves as a proxy for a country’s level of global integration. It uses data on three dimensions of globalization (economic, social and political) to create an overall globalization score between zero and 100 that measures a country’s level of integration in the global system. The variables “regulatory quality”, “government effectiveness” and “voice and accountability” are gathered from the World Bank’s Worldwide Governance Indicators, considering the average of the period 2008-2012. “Regulatory quality” captures perceptions of the ability of the government to formulate and implement sound policies and regulations that permit and promote private sector development. “Government effectiveness” captures perceptions of the quality of public services, the quality of the civil service and the degree of its independence from political pressures, the quality of policy formulation and implementation, and the credibility of the government's commitment to such policies. “Voice and accountability captures perceptions of the extent to which a country's citizens are able to participate in selecting their government, as well as freedom of expression, freedom of association, and a free media. The “failed state” variable is based on the average 2008-2012 of the fragile state index that is a compilation of 12 socio-economic and political variables made by the Fund for Peace. It aims to capture the vulnerability to any kind of stress of a certain state. The “perceived corruption” variable is based on the homonym index published by Transparency International (NGO) averaged from 2008 to 2012. It assesses the level of corruption using qualitative surveys. Finally the “criminal rate” records the average rate (per 100,000 people) of unlawful death, as defined and assessed by the UN Office on Drugs and Crime, in the period 2008-2012. A country with a higher degree of global integration will be better positioned to obtain disaster assistance from the international community. Autarkic or less well-integrated countries may be less able or willing to receive outside assistance in the event of extreme weather events. Such assistance could take the form of aid from bilateral or multilateral donors or international humanitarian organizations, or it could be in the form of remittances from overseas family or diasporas of the affected population. The Worldwide Governance Indicators define the level of expected assistance to citizens to better coping and manage with climate stressors and disaster events in situations measuring the good governance degree of a state. The failed state index measures the state ability to implement adaptation strategies measuring its vulnerability. People living in countries with higher level of corruption are thought to have more difficulties recovering from climate change impacts, due to limited governmental support reaching affected population compared to states with lower level of corruption. Corruption can further be of particular importance when it comes to the distribution of and access to emergency relief resources. Finally the criminal rate is included because violence severely limits a government’s ability to deliver assistance and indicate a lack of authority by central government. This dataset has been produced in the framework of the “Climate change predictions in Sub-Saharan Africa: impacts and adaptations (ClimAfrica)” project, Work Package 4 (WP4). More information on ClimAfrica project is provided in the Supplemental Information section of this metadata.
-
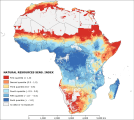
The “natural resources sensitivity” symbolizes the ecosystem vitality and degree of conservation in 2010. Deforestation and loss of water resources quality may render certain areas more sensitive to climate stressors on account of the loss of normal vegetation cover, the depletion of biodiversity, the reduction in ecosystem services and significant loss of beneficial assets. The index results from the first cluster of the Principal Component Analysis preformed among 16 potential variables. The analysis identify five dominant variables, namely “water availability per capita”, “net primary production”, “forest accessibility”, “vegetation continuity” and “climatic resources availability”, assigning respectively the weights of 0.19, 0.21, 0.165, 0.21 and 0.225. Before to perform the analysis the variables “water availability per capita”, “forest accessibility” and “vegetation continuity” were log transformed to shorten the extreme variation and then together with the other two variables were score-standardized (converted to distribution with average of 0 and standard deviation of 1; all variables with inverse method) in order to be comparable. The 6 arc-minute grid “water availability per capita” of 2005 was computed by sum of the run-off and discharge grids produced by World Water Development Report II and then sampled at 0.5 arc-minutes. A focal statistic ran with a radius of 55 cells (about 50 Km). This had a smoothing effect and represents some of the extend influence of major rivers as a resources for local people. To calculate the available water per capita it was then divided by the population. The 5 arc-minute grid “net primary production” of 2000 was gathered from FAO GeoNetwork and sampled at 0.5 arc-minute. Also in this case a focal statistic ran with a radius of 22 cells (about 20 Km) in order to represents the extend effect of primary production as natural resources for local people. The 0.5 arc-minute grid “forest accessibility” was build using the grid of travel distance in minutes to large cities (which one with population greater than 50,000 people), produced by the European Commission and the World Bank to represent the connectivity in 2000, and the grid of forest occurrence, extracted from the FAO Global Land Cover-SHARE dataset of 2014. The result measures the distance in minutes between forest and cities, thus is a proxy for remoteness and naturalness of forest. The 0.125 arc-minute grid “vegetation continuity” of 2010 were collected from University of Maryland and NASA and sampled at 0.5 arc-minute. A focal statistic ran with a radius of 55 cells (about 50 Km). This had a smoothing effect and represents some of the extend influence of vegetation concentration as a resources for local people. Finally the 0.5 arc-minute grid “climatic resources availability” was produced within the ClimAfrica project. The “water availability per capita” represents the potential water available per people in a certain area. We can consider the area with small values more sensitive to climatic stress, because lack a buffer of water resources, precious in a prevalently rain-fed agricultural system like in Africa. The “net primary production” and the “vegetation continuity” are proxies of the potential vegetal productivity available in a certain area. Moreover “vegetation continuity” is an indicator of abundance of natural ecosystem services that can reduce the sensitivity of human-environment systems. The “forest accessibility” assessing the distance between human and natural system measure the anthropogenic degree of a forest. A forest recording a high anthropogenic degree (thus near in terms of minute from a city) may potentially be threaded by human activity and thus represent a fragile ecosystem. Finally the “climatic resources availability” is an indicator of the climatic potential for biomass production. It is based on the climatically determined biomass productivity index that is a proxy for the atmospheric energy available for biomass production, as expressed by accumulated temperature, adjusted for drought stress. This dataset has been produced in the framework of the “Climate change predictions in Sub-Saharan Africa: impacts and adaptations (ClimAfrica)” project, Work Package 4 (WP4). More information on ClimAfrica project is provided in the Supplemental Information section of this metadata.
-

The “financial development index” symbolizes the degree of financial development of a country in 2010. Well-developed financial systems may reduce climate change impact because it underlying the diffusion of services and tertiary economic activity that reduce the dependence to agriculture income of a certain population. The index results from the first cluster of the Principal Component Analysis preformed among 9 potential variables. The analysis identifies three dominant variables, namely “investment per capita”, “global commerce volume per capita” and “gross national saving per capita”, assigning weights of 0.35, 0.35 and 0.3, respectively. Before to perform the analysis all variables were log transformed to shorten the extreme variation and then were score-standardized (converted to distribution with average of 0 and standard deviation of 1) in order to be comparable. Country based data for “investment per capita” (expressed as a ratio of total investment in current local currency and GDP in current local currency. Investment or gross capital formation is measured by the total value of the gross fixed capital formation and changes in inventories and acquisitions less disposals of valuables for a unit or sector), “global commerce volume per capita” (expressed as a ratio of commerce volume in current local currency and GDP in current local currency. Commerce volume is the sum of exports and imports of goods and services) and “gross national saving per capita” (expressed as a ratio of gross national savings in current local currency and GDP in current local currency. Gross national saving is gross disposable income less final consumption expenditure after taking account of an adjustment for pension funds) were collected jointly from International Monetary Fund and World Bank (for global commerce volumes) and records the average of the period 2008-2012. The variables represent the share of GDP, thus they were multiplied by total GDPppp in order to have absolute value in international dollars and then divided by population to calculate the per capita values of each variable. The tabular data were linked by country unit to the national boundaries shapefile (FAO/GAUL) and then converted into raster format (resolution 0.5 arc-minute). Investment and global commerce per capita are proxy of economic transition out of agriculture, while national gross saving represents the financial resources buffer that can facilitate the implementation of climate change adaptation strategies. This dataset has been produced in the framework of the “Climate change predictions in Sub-Saharan Africa: impacts and adaptations (ClimAfrica)” project, Work Package 4 (WP4). More information on ClimAfrica project is provided in the Supplemental Information section of this metadata.