 Stars4Water
ClimAfrica
Type of resources
Available actions
Topics
Keywords
Contact for the resource
Provided by
Years
Formats
Representation types
Update frequencies
status
Resolution
-

A Decadal prediction data set of several atmospheric and oceanic variables is here presented for climate studies and comparisons. Predictions are performed one time every 5 years, with start date on Nov 1st, and integrated for twenty years. Each prediction is constituted of three ensemble members to have a minimal sample of the uncertainty on the initial conditions. The sampled variables are: The sampled variables are: - Specific Humidity (Q) - Relative Humidity (RH) - Temperature (T) - Zonal Wind (U) - Meridional Wind (V) - Surface temperature (surf_temp) - Zonal Wind at 10m (u10) - Meridional Wind at 10m (v10). The decadal predictions data are available for download on demand only. Please contact Andrea Borrelli at andrea.borrelli@cmcc.it to place your request. This data set has been produced in the framework of the "Climate change predictions in Sub-Saharan Africa: impacts and adaptations (ClimAfrica)" project, Work Package 2 (WP2). More information on ClimAfrica project is provided in the Supplemental Information section of this metadata.
-

A seasonal forecast dataset of several atmospheric and oceanic variables is here presented for climate studies and comparisons. Forecasts are performed four times a year, with start dates on Feb 1st, May 1st, Aug 1st, Nov 1st, and integrated for six months. Each forecast is constituted of nine ensemble members to sample the uncertainty on the initial conditions. The sampled variables are: - Specific Humidity (Q) - Relative Humidity (RH) - Temperature (T) - Zonal Wind (U) - Meridional Wind (V) - Surface temperature (surf_temp) - Zonal Wind at 10m (u10) - Meridional Wind at 10m (v10). The seasonal forecast datasets are available for download on demand only. Please contact Stefano Materia at stefano.materia@cmcc.it to place your request. This data set has been produced in the framework of the "Climate change predictions in Sub-Saharan Africa: impacts and adaptations (ClimAfrica)" project, Work Package 2 (WP2). More information on ClimAfrica project is provided in the Supplemental Information section of this metadata.
-
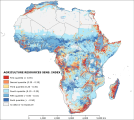
The “agriculture resources sensitivity” represents the agriculture potential in 2010. This potential is measured by the availability of land and food production per capita, and the main thread to agriculture land, represented by desertification risk. The index results from the second cluster of the Principal Component Analysis preformed among 16 potential variables. The analysis identify four dominant variables, namely “potential rain-fed food production per capita”, “cropland crowding”, “desertification index” and “topographic resources availability”, assigning respectively the weights of 0.29, 0.29, 0.27 and 0.15. Before to perform the analysis all the variables were log transformed to shorten the extreme variation and then were score-standardized (converted to distribution with average of 0 and standard deviation of 1; all variables with inverse method except “desertification index”) in order to be comparable. The 5 arc-minute grid “potential rain-fed food production per capita” of 2007 was gathered from FAO GeoNetwork and then sampled at 0.5 arc-minutes. It was multiplied by crop land occurrence dataset, extracted from the FAO Global Land Cover-SHARE dataset of 2014 and divided by population grid in order to compute the per capita values. The 0.5 arc-minute grid “cropland crowding” of 2010 was produced dividing the crop land occurrence (FAO Global Land Cover-SHARE) by the population. The 0.5 arc-minute grid “desertification index” of 2000 was measured in terms of number of months recording values less than 0.75 of the ratio between precipitation (current monthly average) and potential evapo-transpiration (PET, current monthly average). Data of precipitation and PET were gathered from Worldclim and from CGIAR Consortium for Spatial Information, respectively. Finally the 0.5 arc-minute grid “topographic resources availability” was produced within the ClimAfrica project based on SRTM DEM of NASA. The “potential rain-fed food production per capita” measures the availability of food in a certain area produced with subsistence techniques. Cells with low food production are sensitive to climate change impacts because the low input agriculture (dominant in Africa) may not produced sufficient food quantities to support the local populations. The “cropland crowding” is an indicator that assess the availability of crop land hectares per 1,000 people. Sensitive areas are where few crop lands are shared by large population. The “desertification index” assesses the climatological risk of a certain area to be subjected to desertification due to lack of rainfall. Such areas are more sensitive to lost crop land and thus food production quantities due to climate change impacts. The “topographic resources availability” is the percentage of each cell with slopes equal to or lower than 15 %. Landscapes strongly dissected contain less land with agriculture values than plain landscapes. The scarcity of agriculture land may increase the fragility of a system because unable to increase to crop surface to cope with climate change impacts. This dataset has been produced in the framework of the “Climate change predictions in Sub-Saharan Africa: impacts and adaptations (ClimAfrica)” project, Work Package 4 (WP4). More information on ClimAfrica project is provided in the Supplemental Information section of this metadata.
-

The “richness index” represents the level of economical wellbeing a country certain area in 2010. Regions with higher income per capita and low poverty rate and more access to market are wealthier and are therefore better able to prepare for and respond to adversity. The index results from the second cluster of the Principal Component Analysis preformed among 9 potential variables. The analysis identifies four dominant variables, namely “GDPppp per capita”, “agriculture share GDP per agriculture sector worker”, “poverty rate” and “market accessibility”, assigning weights of 0.33, 0.26, 0.25 and 0.16, respectively. Before to perform the analysis all variables were log transformed (except the “agriculture share GDP per agriculture sector worker”) to shorten the extreme variation and then were score-standardized (converted to distribution with average of 0 and standard deviation of 1; inverse method was applied for the “poverty rate” and “market accessibility”) in order to be comparable. The 0.5 arc-minute grid total GDPppp is based on the night time light satellite imagery of NOAA (see Ghosh, T., Powell, R., Elvidge, C. D., Baugh, K. E., Sutton, P. C., & Anderson, S. (2010).Shedding light on the global distribution of economic activity. The Open Geography Journal (3), 148-161) and adjusted to national total as recorded by International Monetary Fund for 2010. The “GDPppp per capita” was calculated dividing the total GDPppp by the population in each pixel. Further, a focal statistic ran to determine mean values within 10 km. This had a smoothing effect and represents some of the extended influence of intense economic activity for the local people. Country based data for “agriculture share GDP per agriculture sector worker” were calculated from GDPppp (data from International Monetary Fund) fraction from agriculture activity (measured by World Bank) divided by the number of worker in the agriculture sector (data from World Bank). The tabular data represents the average of the period 2008-2012 and were linked by country unit to the national boundaries shapefile (FAO/GAUL) and then converted into raster format (resolution 0.5 arc-minute). The first administrative level data for the “poverty rate” were estimated by NOAA for 2003 using nighttime lights satellite imagery. Tabular data were linked by first administrative unit to the first administrative boundaries shapefile (FAO/GAUL) and then converted into raster format (resolution 0.5 arc-minute). The 0.5 arc-minute grid “market accessibility” measures the travel distance in minutes to large cities (with population greater than 50,000 people). This dataset was developed by the European Commission and the World Bank to represent access to markets, schools, hospitals, etc.. The dataset capture the connectivity and the concentration of economic activity (in 2000). Markets may be important for a variety of reasons, including their abilities to spread risk and increase incomes. Markets are a means of linking people both spatially and over time. That is, they allow shocks (and risks) to be spread over wider areas. In particular, markets should make households less vulnerable to (localized) covariate shocks. This dataset has been produced in the framework of the “Climate change predictions in Sub-Saharan Africa: impacts and adaptations (ClimAfrica)” project, Work Package 4 (WP4). More information on ClimAfrica project is provided in the Supplemental Information section of this metadata.
-

The datasets represent monthly Sensible and Latent Heat Flux at 0.5 degree spatial resolution from 1982 - 2010 over the African continent. For a detailed description of the data sets see: Jung, M. et all. (2011) Global patterns of land-atmosphere fluxes of carbon dioxide, latent heat, and sensible heat derived from eddy covariance, satellite, and meteorological observations. Journal of Geophysical Research - Biogeosciences, 116, doi:10.1029/2010JG001566. request by email. This data set has been produced in the framework of the "Climate change predictions in Sub-Saharan Africa: impacts and adaptations (ClimAfrica)" project, Work Package 1 (WP1). WP1 (Past climate variability) aimed to provide consolidated data to other WPs in ClimAfrica, and to analyze the interactions between climate variability, water availability and ecosystem productivity of Sub-Saharan Africa. Various data streams that diagnose the variability of the climate, in particular the water cycle, and the productivity of ecosystems in the past decades, have been collected, analyzed and synthesized. The data streams range from ground-based observations and satellite remote sensing to model simulations. More information on ClimAfrica project is provided in the Supplemental Information section of this metadata.
-

The “financial development index” symbolizes the degree of financial development of a country in 2010. Well-developed financial systems may reduce climate change impact because it underlying the diffusion of services and tertiary economic activity that reduce the dependence to agriculture income of a certain population. The index results from the first cluster of the Principal Component Analysis preformed among 9 potential variables. The analysis identifies three dominant variables, namely “investment per capita”, “global commerce volume per capita” and “gross national saving per capita”, assigning weights of 0.35, 0.35 and 0.3, respectively. Before to perform the analysis all variables were log transformed to shorten the extreme variation and then were score-standardized (converted to distribution with average of 0 and standard deviation of 1) in order to be comparable. Country based data for “investment per capita” (expressed as a ratio of total investment in current local currency and GDP in current local currency. Investment or gross capital formation is measured by the total value of the gross fixed capital formation and changes in inventories and acquisitions less disposals of valuables for a unit or sector), “global commerce volume per capita” (expressed as a ratio of commerce volume in current local currency and GDP in current local currency. Commerce volume is the sum of exports and imports of goods and services) and “gross national saving per capita” (expressed as a ratio of gross national savings in current local currency and GDP in current local currency. Gross national saving is gross disposable income less final consumption expenditure after taking account of an adjustment for pension funds) were collected jointly from International Monetary Fund and World Bank (for global commerce volumes) and records the average of the period 2008-2012. The variables represent the share of GDP, thus they were multiplied by total GDPppp in order to have absolute value in international dollars and then divided by population to calculate the per capita values of each variable. The tabular data were linked by country unit to the national boundaries shapefile (FAO/GAUL) and then converted into raster format (resolution 0.5 arc-minute). Investment and global commerce per capita are proxy of economic transition out of agriculture, while national gross saving represents the financial resources buffer that can facilitate the implementation of climate change adaptation strategies. This dataset has been produced in the framework of the “Climate change predictions in Sub-Saharan Africa: impacts and adaptations (ClimAfrica)” project, Work Package 4 (WP4). More information on ClimAfrica project is provided in the Supplemental Information section of this metadata.
-

A global daily database of satellite soil moisture based on harmonizing multiple passive (SSMR, SSM/I, TRMM, AMSRE, WINDSAT) and active (ERS, MATOP) satellite products. This data set has been produced in the framework of the "Climate change predictions in Sub-Saharan Africa: impacts and adaptations (ClimAfrica)" project, Work Package 1 (WP1). WP1 (Past climate variability) aimed to provide consolidated data to other WPs in ClimAfrica, and to analyze the interactions between climate variability, water availability and ecosystem productivity of Sub-Saharan Africa. Various data streams that diagnose the variability of the climate, in particular the water cycle, and the productivity of ecosystems in the past decades, have been collected, analyzed and synthesized. The data streams range from ground-based observations and satellite remote sensing to model simulations. More information on ClimAfrica project is provided in the Supplemental Information section of this metadata.
-

The “malnourishment index” relates to the degree of food insecurity of a certain region in 2010. A community characterized by scarce food quality supply and thus subject to malnutrition and starvation of large part of its members is prone to suffer from climate change impact on food production. The index results from the second cluster of the Principal Component Analysis preformed among 14 potential variables. The analysis identify four dominant variables, namely “percentage of underweighted children”, “percentage of stunted children”, “diet diversification index” and “animal protein supply”, assigning a weight of 0.25 to the “percentage of underweighted children” and the “percentage of stunted children”, 0.3 to the “animal protein supply” and 0.2 to the “diet diversification index”. Before to perform the analysis the variables were score-standardized (converted to distribution with average of 0 and standard deviation of 1; “diet diversification index” and “animal protein supply” with inverse method) in order to be comparable. The first administrative level data for “percentage of underweighted children” (more than two standard deviations below the mean weight-for-age score of the NCHS/CDC/WHO international reference population) and “percentage of stunted children” (more than two standard deviations below the mean height-for-age score of the NCHS/CDC/WHO international reference population) were derived from the Global Database on Child Growth and Malnutrition of WHO/UNICEF (data range from 1998 to 2012). When subnational data were not available, were used the national values from UNICEF database. Such national figures were used also to normalize to 2010 the values recorded by WHO/UNICEF. Tabular data were linked by first administrative unit to the first administrative boundaries shapefile (FAO/GAUL) and then converted into raster format (resolution 0.5 arc-minute). The country based values for the other two variables were collected from FAO statistics like the average of the period 2008-2012. Tabular data were linked by country to the national boundaries shapefile (FAO/GAUL) and then converted into raster format (resolution 0.5 arc-minute). Malnourishment illustrates the problems of food insecurity and hunger of a population, which has serious consequences on people's physical condition and very negative impacts on the mental and physical development of children. Countries which have worst diet parameters are more sensitive to the effects of the climate change. Indeed low animal protein consumption and low diet diversification (dominated by cereals) are indicators of the lack of alternative food source than local cereals production. This dataset has been produced in the framework of the “Climate change predictions in Sub-Saharan Africa: impacts and adaptations (ClimAfrica)” project, Work Package 4 (WP4). More information on ClimAfrica project is provided in the Supplemental Information section of this metadata.
-

The “element at risk index” describes the distribution in 2010 of the density of element (i.e. people, livestock unit or crop land) that are potentially threaded by climatic stress. When a climatic stress impact a densely populated (in terms of element at risk) the impact is likely to be more severe than it would be in areas with fewer element. The index results from the second cluster of the Principal Component Analysis (PCA) performed among potential 10 variables. The analysis identify three dominant variables, namely “people”, “livestock unit” and “crop land”, assigning a weight of 0.3 to people and weights of 0.35 to the other two variables. Before to perform the analysis the variables were log transformed to shorten the extreme variation and then score-standardized (converted to distribution with average of 0 and standard deviation of 1) in order to be comparable. The 0.5 arc-minute grid of population distribution in 2010 were gathered from Worldpop project website. The methodological approach used by Worldpop Project is described in Tatem et al 2007 (DOI: 10.1371/journal.pone.0001298). The values were adjusted in order to have national population totals equal to the UN Population and Demographic Office estimation per Country (World Population Prospect - the 2012 Revision). The 3 arc-minute grid of livestock distribution were gathered from FAO GeoNetwork (cattle, sheep, goats, pigs and poultry distribution), sampled at 0.5 arc-minute. The values were adjusted to national total livestock abundance in 2010 (FAO stats). The single species abundances were converted to livestock unit (LSU) according FAO methodology. The 0.5 arc-minute grid of crop land distribution were collected from FAO Global Land Cover-SHARE of 2014. The area with less than 1 people and 1 LSU for cell (about 1 Km square) and without cropland were masked and removed from the analysis for all layer because considered not exposed to climatic stress. This dataset has been produced in the framework of the “Climate change predictions in Sub-Saharan Africa: impacts and adaptations (ClimAfrica)” project, Work Package 4 (WP4). More information on ClimAfrica project is provided in the Supplemental Information section of this metadata.
-

A consistent and harmonized product of satellite observed fraction of absorbed photosynthetically active radiation (FAPAR). FAPAR is a biophysical variable that indicates the state and health of the vegetation. This data set provides monthly FAPAR from 1982 until 2010 at global scale and for the African continent. The construction of the data set made use of existing products from AVHRR, SeaWiFS and MERIS satellite sensors. This data set has been produced in the framework of the "Climate change predictions in Sub-Saharan Africa: impacts and adaptations (ClimAfrica)" project, Work Package 1 (WP1). WP1 (Past climate variability) aimed to provide consolidated data to other WPs in ClimAfrica, and to analyze the interactions between climate variability, water availability and ecosystem productivity of Sub-Saharan Africa. Various data streams that diagnose the variability of the climate, in particular the water cycle, and the productivity of ecosystems in the past decades, have been collected, analyzed and synthesized. The data streams range from ground-based observations and satellite remote sensing to model simulations. More information on ClimAfrica project is provided in the Supplemental Information section of this metadata.