 Stars4Water
Society
Type of resources
Available actions
Topics
Keywords
Contact for the resource
Provided by
Years
Formats
Representation types
Update frequencies
status
Scale
Resolution
-

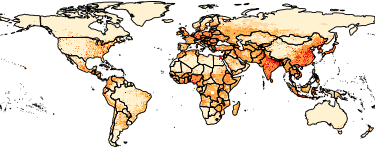
The Gridded Population of the World, Version 4 (GPWv4): Population Density, Revision 11 consists of estimates of human population density (number of persons per square kilometer) based on counts consistent with national censuses and population registers, for the years 2000, 2005, 2010, 2015, and 2020. A proportional allocation gridding algorithm, utilizing approximately 13.5 million national and sub-national administrative units, was used to assign population counts to 30 arc-second grid cells. The population density rasters were created by dividing the population count raster for a given target year by the land area raster. The data files were produced as global rasters at 30 arc-second (~1 km at the equator) resolution. To enable faster global processing, and in support of research communities, the 30 arc-second count data were aggregated to 2.5 arc-minute, 15 arc-minute, 30 arc-minute and 1 degree resolutions to produce density rasters at these resolutions.
-
The Food and Agriculture Organization of the United Nations (FAO) with the collaboration of the International Institute for Applied Systems Analysis (IIASA), has developed a system that enables rational land-use planning on the basis of an inventory of land resources and evaluation of biophysical limitations and potentials. This is referred to as the Agro-ecological Zones (AEZ) methodology.
-

On 8 November 2013, Typhoon Haiyan made landfall in the Philippines causing widespread devastation, tremendous loss of life and catastrophic impact on infrastructure and natural resources. As a result of the devastating damage to agriculture and fisheries sectors and the severe impact on lives and livelihoods FAO has declared Level 3 Emergency Response. In response to the call for needs assessment and coordinating humanitarian assistance in agriculture and fisheries sectors the FAO, Land and Water Division Geospatial Unit collected a number of datasets from various sources including FAO, WFP, UNITAR-UNOSAT, EC-JRC, USDA, USGS as well as updated reports from national agencies as well as the National Disaster Risk Reduction and Management council. Severity zones were mapped using data from the EC-JRC updates based on the Public Storm Warning Signals (PSWC) in four main levels: S1-very high for PSWC #1, S2-high for PSWC #2, S3-medium for PSWC #3 and S4-medium-low for PSWC#4. The severity area mask was calibrated using remote sensing data combined with the data reported on November 13, 2013 by the National Disaster Risk Reduction and Management Council of Philippines. The severity intensity rate was classified proportionally with the affected population figures. The data on crop production, harvested area, yield for major crops were collected from FAO, Global Spatial Database of Agricultural Land-Use Statistics AgroMaps ( http://kids.fao.org/agromaps ), FAOSTAT ( http://faostat.fao.org/) and Bureau of Agricultural Statistics of Philippines (http://countrystat.bas.gov.ph ). Data on arable land and permanent crops were derived from the FAO Global Land Cover Share database (Beta-version) and data on the area by district were derived by the FAO Global Administrative Units Layer, GAUL version 2013-12 (www.fao.org/geonetwork). In addition data on crop calendars to identify crop growing stage were collected from the FAO-IIASA Global Agro-Ecological Zones Data portal, GAEZ (www.fao.org/nr/gaez) , FAO Crop Calendar from Data@Fao.org (https://data.apps.fao.org/) and FAO Agricultural Market Information System, AMIS (http://www.amis-outlook.org/) .Philippines rice crop calendar was provided by the Philippines Rice Research Institute (PhilRice-DA), International Rice Research Institute (IRRI). The assessment was done by first georefencing, harmonizing and creating a central database in the UTM WGS 84 reference system. Areas of crop growth stages were analyzed according to their stage at the time of the event. Major season and secondary season for rice were considered for analysis at the time of the event. The areas of standing rice at the moment of the event were mapped using the district level crop calendars for the major season. Also the planted rice areas for the second season were mapped. The affected area was then calculated considering both these areas which were considered as area loss, calibrated by the severity intensity rate class. The extent (ha) and fraction (%) of the potential affected crop areas was calculated by intersecting the tropical cyclone severity areas with the administrative layers, arable land and permanent crops, annual harvested area, yield and production for year 2012 (which was used as a proxy to assess the planted area). Major crops which were affected include Rice Paddy, Coconut and Sugar Cane. The maps show the impacts of the tropical cyclone on these crops. The outputs were classified in 5 classes of affected areas: less the 10%, 10-25%, 25-50%, 50-75%, and >75%. The tabular information provides information on the estimated affected area for Rice Paddy (extent in ha and share in percentage) by Typhoon “YOLANDA” (HAIYAN) severity Level and by District (updated on 15 November 2013). The affected planted areas for each severity zone were calculated as a fraction of the planted area versus by severity zone by administrative unit area. In addition, the analysis was done for major livestock, pig, poultry and cattle, affected population. Sources: Agromaps, FAOSTAT, CountrySTAT Philippines, GAEZ, AMIS, GLC-SHARE, FAO NRL Geospatial Unit datasets, Data@FAO.ORG, EC-JRC, ESA GlobCover, UNITAR, UNOSAT, WFP, National Disaster Risk Reduction and Management Council, Republic of Philippines, Philippines rice crop calendar, Philippines Rice Research Institute (PhilRice-DA), International Rice Research Institute (IRRI) sponsored by the DA-National Rice Program via the Rice Self Sufficiency Program (RSSP) and the Global Rice Science Partnership (GRiSP), the CGIAR Research Program on Rice.
-
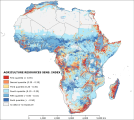
The “agriculture resources sensitivity” represents the agriculture potential in 2010. This potential is measured by the availability of land and food production per capita, and the main thread to agriculture land, represented by desertification risk. The index results from the second cluster of the Principal Component Analysis preformed among 16 potential variables. The analysis identify four dominant variables, namely “potential rain-fed food production per capita”, “cropland crowding”, “desertification index” and “topographic resources availability”, assigning respectively the weights of 0.29, 0.29, 0.27 and 0.15. Before to perform the analysis all the variables were log transformed to shorten the extreme variation and then were score-standardized (converted to distribution with average of 0 and standard deviation of 1; all variables with inverse method except “desertification index”) in order to be comparable. The 5 arc-minute grid “potential rain-fed food production per capita” of 2007 was gathered from FAO GeoNetwork and then sampled at 0.5 arc-minutes. It was multiplied by crop land occurrence dataset, extracted from the FAO Global Land Cover-SHARE dataset of 2014 and divided by population grid in order to compute the per capita values. The 0.5 arc-minute grid “cropland crowding” of 2010 was produced dividing the crop land occurrence (FAO Global Land Cover-SHARE) by the population. The 0.5 arc-minute grid “desertification index” of 2000 was measured in terms of number of months recording values less than 0.75 of the ratio between precipitation (current monthly average) and potential evapo-transpiration (PET, current monthly average). Data of precipitation and PET were gathered from Worldclim and from CGIAR Consortium for Spatial Information, respectively. Finally the 0.5 arc-minute grid “topographic resources availability” was produced within the ClimAfrica project based on SRTM DEM of NASA. The “potential rain-fed food production per capita” measures the availability of food in a certain area produced with subsistence techniques. Cells with low food production are sensitive to climate change impacts because the low input agriculture (dominant in Africa) may not produced sufficient food quantities to support the local populations. The “cropland crowding” is an indicator that assess the availability of crop land hectares per 1,000 people. Sensitive areas are where few crop lands are shared by large population. The “desertification index” assesses the climatological risk of a certain area to be subjected to desertification due to lack of rainfall. Such areas are more sensitive to lost crop land and thus food production quantities due to climate change impacts. The “topographic resources availability” is the percentage of each cell with slopes equal to or lower than 15 %. Landscapes strongly dissected contain less land with agriculture values than plain landscapes. The scarcity of agriculture land may increase the fragility of a system because unable to increase to crop surface to cope with climate change impacts. This dataset has been produced in the framework of the “Climate change predictions in Sub-Saharan Africa: impacts and adaptations (ClimAfrica)” project, Work Package 4 (WP4). More information on ClimAfrica project is provided in the Supplemental Information section of this metadata.
-

The “richness index” represents the level of economical wellbeing a country certain area in 2010. Regions with higher income per capita and low poverty rate and more access to market are wealthier and are therefore better able to prepare for and respond to adversity. The index results from the second cluster of the Principal Component Analysis preformed among 9 potential variables. The analysis identifies four dominant variables, namely “GDPppp per capita”, “agriculture share GDP per agriculture sector worker”, “poverty rate” and “market accessibility”, assigning weights of 0.33, 0.26, 0.25 and 0.16, respectively. Before to perform the analysis all variables were log transformed (except the “agriculture share GDP per agriculture sector worker”) to shorten the extreme variation and then were score-standardized (converted to distribution with average of 0 and standard deviation of 1; inverse method was applied for the “poverty rate” and “market accessibility”) in order to be comparable. The 0.5 arc-minute grid total GDPppp is based on the night time light satellite imagery of NOAA (see Ghosh, T., Powell, R., Elvidge, C. D., Baugh, K. E., Sutton, P. C., & Anderson, S. (2010).Shedding light on the global distribution of economic activity. The Open Geography Journal (3), 148-161) and adjusted to national total as recorded by International Monetary Fund for 2010. The “GDPppp per capita” was calculated dividing the total GDPppp by the population in each pixel. Further, a focal statistic ran to determine mean values within 10 km. This had a smoothing effect and represents some of the extended influence of intense economic activity for the local people. Country based data for “agriculture share GDP per agriculture sector worker” were calculated from GDPppp (data from International Monetary Fund) fraction from agriculture activity (measured by World Bank) divided by the number of worker in the agriculture sector (data from World Bank). The tabular data represents the average of the period 2008-2012 and were linked by country unit to the national boundaries shapefile (FAO/GAUL) and then converted into raster format (resolution 0.5 arc-minute). The first administrative level data for the “poverty rate” were estimated by NOAA for 2003 using nighttime lights satellite imagery. Tabular data were linked by first administrative unit to the first administrative boundaries shapefile (FAO/GAUL) and then converted into raster format (resolution 0.5 arc-minute). The 0.5 arc-minute grid “market accessibility” measures the travel distance in minutes to large cities (with population greater than 50,000 people). This dataset was developed by the European Commission and the World Bank to represent access to markets, schools, hospitals, etc.. The dataset capture the connectivity and the concentration of economic activity (in 2000). Markets may be important for a variety of reasons, including their abilities to spread risk and increase incomes. Markets are a means of linking people both spatially and over time. That is, they allow shocks (and risks) to be spread over wider areas. In particular, markets should make households less vulnerable to (localized) covariate shocks. This dataset has been produced in the framework of the “Climate change predictions in Sub-Saharan Africa: impacts and adaptations (ClimAfrica)” project, Work Package 4 (WP4). More information on ClimAfrica project is provided in the Supplemental Information section of this metadata.
-

The “financial development index” symbolizes the degree of financial development of a country in 2010. Well-developed financial systems may reduce climate change impact because it underlying the diffusion of services and tertiary economic activity that reduce the dependence to agriculture income of a certain population. The index results from the first cluster of the Principal Component Analysis preformed among 9 potential variables. The analysis identifies three dominant variables, namely “investment per capita”, “global commerce volume per capita” and “gross national saving per capita”, assigning weights of 0.35, 0.35 and 0.3, respectively. Before to perform the analysis all variables were log transformed to shorten the extreme variation and then were score-standardized (converted to distribution with average of 0 and standard deviation of 1) in order to be comparable. Country based data for “investment per capita” (expressed as a ratio of total investment in current local currency and GDP in current local currency. Investment or gross capital formation is measured by the total value of the gross fixed capital formation and changes in inventories and acquisitions less disposals of valuables for a unit or sector), “global commerce volume per capita” (expressed as a ratio of commerce volume in current local currency and GDP in current local currency. Commerce volume is the sum of exports and imports of goods and services) and “gross national saving per capita” (expressed as a ratio of gross national savings in current local currency and GDP in current local currency. Gross national saving is gross disposable income less final consumption expenditure after taking account of an adjustment for pension funds) were collected jointly from International Monetary Fund and World Bank (for global commerce volumes) and records the average of the period 2008-2012. The variables represent the share of GDP, thus they were multiplied by total GDPppp in order to have absolute value in international dollars and then divided by population to calculate the per capita values of each variable. The tabular data were linked by country unit to the national boundaries shapefile (FAO/GAUL) and then converted into raster format (resolution 0.5 arc-minute). Investment and global commerce per capita are proxy of economic transition out of agriculture, while national gross saving represents the financial resources buffer that can facilitate the implementation of climate change adaptation strategies. This dataset has been produced in the framework of the “Climate change predictions in Sub-Saharan Africa: impacts and adaptations (ClimAfrica)” project, Work Package 4 (WP4). More information on ClimAfrica project is provided in the Supplemental Information section of this metadata.