 Stars4Water
landcover
Type of resources
Available actions
Topics
Keywords
Contact for the resource
Provided by
Representation types
Update frequencies
status
Scale
-
The map shows the ratio of total withdrawals to the available renewable water resource. Renewable water resources are downscaled to a five arc-minute grid. Water is considered scarce when the withdrawals exceed 40% of the renewable resource. According to statistics compiled by FAO (FAOSTAT),several countries in North Africa, the Middle East and Central Asia withdraw more water than their total renewable resources. Domestic water withdrawals are downscaled by applying the per capita domestic water use to population of each pixel. Industrial water withdrawals were downscaled by using the industrial water use per unit GDP and applying downscaled information on GDP. Water consumption is assumed to be 30% of domestic use and 10% of industrial use. Finally, agricultural water consumption is assumed to be the crop water deficit in irrigated areas generated in the AEZ analysis and water used for livestock consumption, applied to a global spatial data set of livestock distribution prepared by FAO.Source of the map: GAEZ 2009 and AQUASTAT; downscaling simulations by authors.
-
The map shows the total annual water withdrawal. Water withdrawals are downscaled to to a five arc-minute grid. Water is considered scarce when the withdrawals exceed 40% of the renewable resource. According to statistics compiled by FAO (FAOSTAT), several countries in North Africa, the Middle East and Central Asia withdraw more water than their total renewable resources. Domestic water withdrawals are downscaled by applying the per capita domestic water use to population of each pixel. Industrial water withdrawals were downscaled by using the industrial water use per unit GDP and applying downscaled information on GDP. Water consumption is assumed to be 30% of domestic use and 10% of industrial use. Finally, agricultural water consumption is assumed to be the crop water deficit in irrigated areas generated in the AEZ analysis and water used for livestock consumption, applied to a global spatial data set of livestock distribution prepared by FAO. Source of the map: GAEZ 2009 and AQUASTAT; downscaling simulations by authors.
-
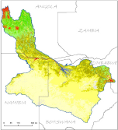
This raster layer represents the land cover classification within the Okavango Basin. Source: Generated under the GIS EPSMO program (Classification based on MODIS Vegetation Continues Fields data from 2000-2005). This dataset is part of the GIS Database for the Environment Protection and Sustainable Management of the Okavango River Basin project (EPSMO). Detailed information on the database can be found in the “GIS Database for the EPSMO Project†document produced by Luis Veríssimo (FAO consultant) in July 2009, and here available for download.