 Stars4Water
imageryBaseMapsEarthCover
Type of resources
Available actions
Topics
Keywords
Contact for the resource
Provided by
Years
Formats
Representation types
Update frequencies
status
Scale
Resolution
-
A set of 6 medium scale (250k) topographic maps, that share geographical overlapping with the Okavango Basin. Source: The Surveyor General, Harare, Zimbabwe. Original data georeferenced under the GIS EPSMO program. This dataset is part of the GIS Database for the Environment Protection and Sustainable Management of the Okavango River Basin project (EPSMO). Detailed information on the database can be found in the “GIS Database for the EPSMO Project†document produced by Luis Veríssimo (FAO consultant) in July 2009, and here available for download.
-
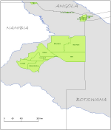
Delineation of Communal Conservancies in Namibia, that share geographical overlapping with the Okavango Basin. Source: Ministry of Agriculture, Water and Forestry of Namibia. This dataset is part of the GIS Database for the Environment Protection and Sustainable Management of the Okavango River Basin project (EPSMO). Detailed information on the database can be found in the “GIS Database for the EPSMO Project†document produced by Luis Veríssimo (FAO consultant) in July 2009, and here available for download.
-

The Food and Agriculture Organization of the United Nations (FAO) with the collaboration of the International Institute for Applied Systems Analysis (IIASA), has developed a system that enables rational land-use planning on the basis of an inventory of land resources and evaluation of biophysical limitations and potentials. This is referred to as the Agro-ecological Zones (AEZ) methodology.
-

Complete set of 23 medium scale topographic maps, that share geographical overlapping with the Okavango Basin. Source: Instituto de Geodesia e Cartografia de Angola (IGCA), Luanda. Original data georeferenced under the GIS EPSMO program. This dataset is part of the GIS Database for the Environment Protection and Sustainable Management of the Okavango River Basin project (EPSMO). Detailed information on the database can be found in the “GIS Database for the EPSMO Project†document produced by Luis Veríssimo (FAO consultant) in July 2009, and here available for download.
-

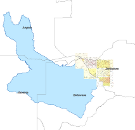
Land use units in Botswana, that share geographical overlapping with the Okavango Basin. Source: The Botswana National Atlas (The Department of Survey and Mapping). This dataset is part of the GIS Database for the Environment Protection and Sustainable Management of the Okavango River Basin project (EPSMO). Detailed information on the database can be found in the “GIS Database for the EPSMO Project†document produced by Luis Veríssimo (FAO consultant) in July 2009, and here available for download.
-

A set of 13 ortho-image maps was elaborated for the main settlements in the basin at the nominal scale of 1/5 000 (the coverage is constrained by the free availability of data). Source: Free of charge acquisition and pre processing under the GIS EPSMO program. This dataset is part of the GIS Database for the Environment Protection and Sustainable Management of the Okavango River Basin project (EPSMO). Detailed information on the database can be found in the “GIS Database for the EPSMO Project†document produced by Luis Veríssimo (FAO consultant) in July 2009, and here available for download.
-
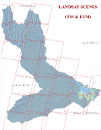
Partial coverage of band compositions data of Landsat MSS, Landsat TM and Landsat ETM, in the decadal intervals of 1972-87 (MSS), 1987-97 (TM), 1999-2008 (ETM). Source: Free of charge acquisition (Global Land Cover Facility) and pre processing under the GIS EPSMO program. This dataset is part of the GIS Database for the Environment Protection and Sustainable Management of the Okavango River Basin project (EPSMO). Detailed information on the database can be found in the “GIS Database for the EPSMO Project†document produced by Luis Veríssimo (FAO consultant) in July 2009, and here available for download.
-

The datasets represent monthly Sensible and Latent Heat Flux at 0.5 degree spatial resolution from 1982 - 2010 over the African continent. For a detailed description of the data sets see: Jung, M. et all. (2011) Global patterns of land-atmosphere fluxes of carbon dioxide, latent heat, and sensible heat derived from eddy covariance, satellite, and meteorological observations. Journal of Geophysical Research - Biogeosciences, 116, doi:10.1029/2010JG001566. request by email. This data set has been produced in the framework of the "Climate change predictions in Sub-Saharan Africa: impacts and adaptations (ClimAfrica)" project, Work Package 1 (WP1). WP1 (Past climate variability) aimed to provide consolidated data to other WPs in ClimAfrica, and to analyze the interactions between climate variability, water availability and ecosystem productivity of Sub-Saharan Africa. Various data streams that diagnose the variability of the climate, in particular the water cycle, and the productivity of ecosystems in the past decades, have been collected, analyzed and synthesized. The data streams range from ground-based observations and satellite remote sensing to model simulations. More information on ClimAfrica project is provided in the Supplemental Information section of this metadata.
-
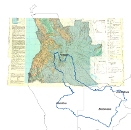
Geology and Hydrogeology Map of Angola, that shares geographical overlapping with the Okavango Basin. Source: Instituto de Geodesia e Cartografia de Angola (IGCA), Luanda. Original data georeferenced under the GIS EPSMO program. This dataset is part of the GIS Database for the Environment Protection and Sustainable Management of the Okavango River Basin project (EPSMO). Detailed information on the database can be found in the “GIS Database for the EPSMO Project†document produced by Luis Veríssimo (FAO consultant) in July 2009, and here available for download.
-

Complete set of 16 medium scale topographic maps, that share geographical overlapping with the Okavango Basin. Source: Instituto de Geodesia e Cartografia de Angola (IGCA), Luanda. Original data georeferenced under the GIS EPSMO program. This dataset is part of the GIS Database for the Environment Protection and Sustainable Management of the Okavango River Basin project (EPSMO). Detailed information on the database can be found in the “GIS Database for the EPSMO Project†document produced by Luis Veríssimo (FAO consultant) in July 2009, and here available for download.