 Stars4Water
Environment
Type of resources
Available actions
Topics
Keywords
Contact for the resource
Provided by
Years
Formats
Representation types
Update frequencies
status
Scale
Resolution
-
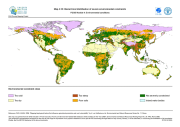
The FGGD severe environmental constraints map is a global raster datalayer with a resolution of 5 arc-minutes. Pixels with no severe environmental constraints contain a value of zero. Each other pixel contains a cumulative class value that shows which environmental constraint is binding in the pixel area. The data are from FAO and IIASA, 2000, Global agro-ecological zones, as reported in FAO and IIASA, 2007, Mapping biophysical factors that influence agricultural production and rural vulnerability, by H. von Velthuizen et al.
-
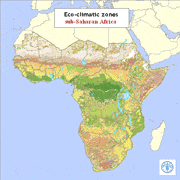
Eco-climatic zones were produced taking into account land-surface and atmospheric characteristics (the photosynthetic activity, the temperature of the earth?s surface, the atmospheric drying power, the rainfall, the potential evapotranspiration, the length of growing period for plants, the surface elevation). Most of these features could be accurately predicted using satellite data; some others needed a combination of remotely sensed and ground-based data. Remotely sensed data were acquired by NOAA-AVHRR sensor and by Meteosat satellite. The AVHRR satellite data were available in dekadal images for a 13 year series from 1982-1994. Meteosat imagery runs from 1988 to 1997. The information layer was produced for FAO in January 1999 by Environmental Research Group Oxford (ERGO Ltd) in collaboration with the Trypanosomosis and Land Use in Africa (TALA) research group at the Department of Zoology, University of Oxford.
-

On 8 November 2013, Typhoon Haiyan made landfall in the Philippines causing widespread devastation, tremendous loss of life and catastrophic impact on infrastructure and natural resources. As a result of the devastating damage to agriculture and fisheries sectors and the severe impact on lives and livelihoods FAO has declared Level 3 Emergency Response. In response to the call for needs assessment and coordinating humanitarian assistance in agriculture and fisheries sectors the FAO, Land and Water Division Geospatial Unit collected a number of datasets from various sources including FAO, WFP, UNITAR-UNOSAT, EC-JRC, USDA, USGS as well as updated reports from national agencies as well as the National Disaster Risk Reduction and Management council. Severity zones were mapped using data from the EC-JRC updates based on the Public Storm Warning Signals (PSWC) in four main levels: S1-very high for PSWC #1, S2-high for PSWC #2, S3-medium for PSWC #3 and S4-medium-low for PSWC#4. The severity area mask was calibrated using remote sensing data combined with the data reported on November 13, 2013 by the National Disaster Risk Reduction and Management Council of Philippines. The severity intensity rate was classified proportionally with the affected population figures. The data on crop production, harvested area, yield for major crops were collected from FAO, Global Spatial Database of Agricultural Land-Use Statistics AgroMaps ( http://kids.fao.org/agromaps ), FAOSTAT ( http://faostat.fao.org/) and Bureau of Agricultural Statistics of Philippines (http://countrystat.bas.gov.ph ). Data on arable land and permanent crops were derived from the FAO Global Land Cover Share database (Beta-version) and data on the area by district were derived by the FAO Global Administrative Units Layer, GAUL version 2013-12 (www.fao.org/geonetwork). In addition data on crop calendars to identify crop growing stage were collected from the FAO-IIASA Global Agro-Ecological Zones Data portal, GAEZ (www.fao.org/nr/gaez) , FAO Crop Calendar from Data@Fao.org (https://data.apps.fao.org/) and FAO Agricultural Market Information System, AMIS (http://www.amis-outlook.org/) .Philippines rice crop calendar was provided by the Philippines Rice Research Institute (PhilRice-DA), International Rice Research Institute (IRRI). The assessment was done by first georefencing, harmonizing and creating a central database in the UTM WGS 84 reference system. Areas of crop growth stages were analyzed according to their stage at the time of the event. Major season and secondary season for rice were considered for analysis at the time of the event. The areas of standing rice at the moment of the event were mapped using the district level crop calendars for the major season. Also the planted rice areas for the second season were mapped. The affected area was then calculated considering both these areas which were considered as area loss, calibrated by the severity intensity rate class. The extent (ha) and fraction (%) of the potential affected crop areas was calculated by intersecting the tropical cyclone severity areas with the administrative layers, arable land and permanent crops, annual harvested area, yield and production for year 2012 (which was used as a proxy to assess the planted area). Major crops which were affected include Rice Paddy, Coconut and Sugar Cane. The maps show the impacts of the tropical cyclone on these crops. The outputs were classified in 5 classes of affected areas: less the 10%, 10-25%, 25-50%, 50-75%, and >75%. The tabular information provides information on the estimated affected area for Rice Paddy (extent in ha and share in percentage) by Typhoon “YOLANDA” (HAIYAN) severity Level and by District (updated on 15 November 2013). The affected planted areas for each severity zone were calculated as a fraction of the planted area versus by severity zone by administrative unit area. In addition, the analysis was done for major livestock, pig, poultry and cattle, affected population. Sources: Agromaps, FAOSTAT, CountrySTAT Philippines, GAEZ, AMIS, GLC-SHARE, FAO NRL Geospatial Unit datasets, Data@FAO.ORG, EC-JRC, ESA GlobCover, UNITAR, UNOSAT, WFP, National Disaster Risk Reduction and Management Council, Republic of Philippines, Philippines rice crop calendar, Philippines Rice Research Institute (PhilRice-DA), International Rice Research Institute (IRRI) sponsored by the DA-National Rice Program via the Rice Self Sufficiency Program (RSSP) and the Global Rice Science Partnership (GRiSP), the CGIAR Research Program on Rice.
-

The map summarizes the status of the land use and land cover at global scale. It was compiled according to the current GAEZ (Global Agro-Ecological Zones) -2009 approach, developed by FAO in collaboration with IIASA (International Institute for Applied Systems Analysis).The current Global AEZ (GAEZ-2009) offers a standardized framework for the characterization of climate, soil and terrain conditions relevant to agricultural production, which can be applied at global to sub-national levels. The map is based on six geographic datasets: - GLC2000 land cover database at 30 arc-sec (http://www-gvm.jrc.it/glc2000), using regional and global legends (JRC, 2006); - an IFPRI global land cover categorization providing 17 land cover classes at 30 arc-sec. (IFPRI, 2002), based on a reinterpretation of the Global Land Cover Characteristics Database (GLCC ver. 2.0), EROS Data Centre (EDC, 2000); - FAO’s Global Forest Resources Assessment 2000 and 2005 (FAO, 2001; FAO, 2006) at 30 arc-sec. resolution; - digital Global Map of Irrigated Areas (GMIA) version 4.0 of (FAO/University of Frankfurt) at 5’ by 5’ latitude/longitude resolution, providing by grid-cell the percentage land area equipped with irrigation infrastructure (Siebert et al., 2007); - a spatial population density inventory (30-arc seconds) for year 2000 developed by FAO-SDRN, based on spatial data of LANDSCAN 2003, with calibration to UN 2000 population figures. An iterative calculation procedure has been implemented to estimate land cover class weights, consistent with aggregate FAO land statistics and spatial land cover patterns obtained from remotely sensed data, allowing the quantification of major land use/land cover shares in individual 5’ by 5’ latitude/longitude grid cells.
-
This dataset is one derivative product from GAEZ v4 for year 2015 that includes gridded (5-arcminute resolution) irrigated and rainfed crop harvested area and crop yield for 26 different crops/crop categories (please see GAEZ_2015_Dimension_crops.csv for the full list). For each country, the production for each crop was extracted from the FAOSTAT database (http://www.fao.org/faostat/en/#data/QC; data downloaded April 2020). The three years average (2009-2011) of annual national crop production data was considered to represent 2010 national crop production, and the three years average (2014-2016) of annual crop production data to represent 2015 national crop production. The method for updating crop production from 2010 to 2015 was the same as described for crop harvested area, except using the 2010 national crop areas, A_(P_(m,2010))^k and the crop production ratio FP,m,i. Unit of measure Crop Production: 1000 tonnes (10e6 kg) per 5-arcminute grid cell More information about this global gridded crop harvest area, crop production, and crop yield and selected crops dataset is available in the full metadata at https://data.apps.fao.org/map/catalog/srv/eng/catalog.search#/metadata/74bab234-3a1e-442d-93cf-0b34859e9a60
-
On the basis of soil parameters provided by the Harmonized World Soil Database (HWSD) seven key soil qualities important for crop production have been derived, namely: nutrient availability, nutrient retention capacity, rooting conditions, oxygen availability to roots, excess salts, toxicities, and workability. Soil qualities are related to the agricultural use of the soil and more specifically to specific crop requirements and tolerances. For the illustration of soil qualities, maize was selected as reference crop because of its global importance and wide geographical distribution. Rooting conditions (SQ3) Rooting conditions include effective soil depth (cm) and effective soil volume (vol. %) related to presence of gravel and stoniness. Rooting conditions may be affected by the presence of a soil phase either limiting the effective rooting depth or decreasing the effective volume accessible for root penetration. Rooting conditions address various relations between soil conditions of the rooting zone and crop growth. The following factors are considered in the evaluation: Adequacy of foothold, i.e., sufficient soil depth for the crop for anchoring; available soil volume and penetrability of the soil for roots to extract nutrients; space for root and tuber crops for expansion and economic yield in the soil; and absence of shrinking and swelling properties (vertic) affecting root and tuber crops. Soil depth/volume limitations affect root penetration and may constrain yield formation (roots and tubers). Relevant soil properties considered are: soil depth, soil texture/structure, vertic properties, gelic properties, petric properties and presence of coarse fragments. This soil quality is estimated by multiplying of the soil depth limitation with the most limiting soil or soil phase property Soil phases that relevant for rooting conditions vary somewhat with source of soil map and soil classification used. In the HWSD these are: FAO 74 soil phases: stony, lithic, petric, petrocalcic, petrogypsic, petroferric, fragipan and duripan. FAO 90 soil phases: rudic, lithic, pertroferric, placic, skeletic, fragipan and duripan. ESB soil phases and other soil depth/volume related characteristics: stony, lithic, petrocalcic, petroferric, fragipan and duripan, and presence of gravel or concretions, obstacles to roots (6 classes), and impermeable layers (4 classes). Note that the classes used in the Soil Quality evaluation are: 1: No or slight limitations 2: Moderate limitations 3: Sever limitations 4: Very severe limitations 5: Mainly non-soil 6: Permafrost area 7: Water bodies Remember that classes are qualitative not quantitative. Only classes 1 to 4 are corresponding to an assessment of soil limitations for plant growth. Class 1 is generally rated between 80 and 100% of the growth potential, class 2 between 60 and 80%, class 3 between 40 and 60%, and class 4 less than 40%.
-

The Koeppen-Geiger climate classification is based on a subdivision of terrestrial climates into five major types, which are represented by the capital letters A (tropical), B (dry), C (temperate), D (cold), and E (polar). Each of these climate types, except for B, is defined by temperature criteria. Type B designates climates in which the controlling factor on vegetation is dryness (rather than coldness). Dry climates are divided into arid (BW) and semi-arid (BS) subtypes. Other climate types are sub-divided according to seasonal precipitation characteristics. The level-2 classification distinguishes 14 classes. CRUTS32 as climate data source is used based on historical data for the time period 1981-2010. The Koeppen-Geiger climate classification dataset is part of the GAEZ v4 Theme 2 Agro-climatic Resources, Climate Classification sub-theme. For additional information on agro-climatic resources and indicators, please to Chapter 3 of the GAEZ v4 Model Documentation.
-
This dataset forms part of a global livestock mapping project by the Food and Agriculture Organization's Animal Production and Health Division (FAO-AGA). The methodology and sources of data are fully described in a document entitled: "The Gridded Livestock of the World FAO (2007)". In summary, for each country the most recent available sub-national livestock census data and corresponding administrative boundaries have been collected. These are then converted into densities, excluding land unsuitable for livestock (either monogastric or ruminant), to provide the 'observed' data. The data are then disaggregated based on statistical relations with some environmental variables in similar agro-ecological zones to produce the 'predicted' distribution. The predicted data are further manipulated to match national census totals for the year 2000 and the year 2005 according to the FAOSTAT database. The project includes: a global network of data providers on livestock and sub-national boundaries; an Oracle database in which these data are managed and processed; a system for predicting livestock distributions based on environmental data and an interactive web application, the Global Livestock Production and Health Atlas (GLiPHA - http://www.fao.org/ag/aga/glipha/index.jsp), through which data are viewed and disseminated. The files are in a raster GRID format, with an ArcGis layer file and an ArcView legend file. Pixel values represent actual densities (per square kilometre). Projection details are given in the metadata. The map should ideally be viewed with the overlay of national boundaries, water bodies and unsuitable land. All of these supplementary data are available in accompanying zip files. These data have been produced by FAO's Animal Production and Health Division in collaboration with ERGO and the TALA research group, University of Oxford, UK.
-

Average attainable yield of current cropland for wheat, cotton and sugarcane under irrigated conditions and high input level, with and without CO2 fertilization, using different climate data source and based on different Representative Concentration Pathways (RCPs) according to the time period as follows: - climate data source CRUTS32 based on historical data for the time period 1981-2010; - climate data source ENSEMBLE based on the Representative Concentration Pathway RCP8.5 for time period 2041-2070. The Average attainable yield of current cropland dataset is part of the GAEZ v4 Suitability and Attainable Yield - Agro-Ecological Attainable Yield. For additional information, please refer to the GAEZ v4 Model Documentation.
-

This map provides a representation of levels of water scarcity by major hydrological basin, expressed in terms of the ratio between irrigation water that is consumed by plants through evapotranspiration and renewable fresh water resources. Contrarily to previous water scarcity maps, this map uses consumptive use of water rather than water withdrawal. Renewable fresh water resources as well as net irrigation water requirements in the river basin are calculated through a water balance model, with information regarding climate, soils and irrigated agriculture as input data. The legend distinguishes three classes: • Water scarcity in river basins where evapotranspiration due to irrigation is less than 10% of the total renewable water resources is classified as low; • Water scarcity in river basins where evapotranspiration due to irrigation is in between 10% and 20% of the total renewable water resources is classified as moderate; • Water scarcity in river basins where evapotranspiration due to irrigation is more than 20% of the total renewable water resources is classified as high.