 Stars4Water
precipitation
Type of resources
Available actions
Topics
Keywords
Contact for the resource
Provided by
Years
Formats
Representation types
Update frequencies
status
Scale
Resolution
-
The Food and Agriculture Organization of the United Nations (FAO) with the collaboration of the International Institute for Applied Systems Analysis (IIASA), has developed a system that enables rational land-use planning on the basis of an inventory of land resources and evaluation of biophysical limitations and potentials. This is referred to as the Agro-ecological Zones (AEZ) methodology.
-
Annual temperature sum for days with Ta >5 °C (degree-days) at about 9 km resolution at the equator, using different climate data source and based on different Representative Concentration Pathways (RCPs) according to the time period as follows: - climate data source CRUTS32 based on historical data for the time period 1981-2010; - climate data source ENSEMBLE based on the Representative Concentration Pathway RCP8.5 for time periods 2041-2070 and 2071-2100. The Annual temperature sum for days with Ta >5 °C (degree-days) dataset is part of the GAEZ v4 Agro-climatic Resources - Thermal Regime sub-theme. For additional information, please refer to the GAEZ v4 Model Documentation.
-
Grid with average Wet Day Frequency (rain days per month) for the period 1961-1990. This dataset is constructed from observations, backed with synthetic data derived from precipitation. Source: New, M., Lister, D., Hulme, M. and Makin, I., 2002: A high-resolution data set of surface climate over global land areas. Climate Research 21:1-25
-

Grid of estimated aridity with a spatial resolution of 10 arc minutes. This dataset represents average yearly precipitation divided by average yearly potential evapotranspiration, an aridity index defined by the United Nations Environmental Programme (UNEP). The classification of the aridity index is: - Classification Aridity Index Global land area - Hyperarid AI < 0.05 - 7.5% of the global land area - Arid 0.05 < AI < 0.20 - 12.1% of the global land area - Semi-arid 0.20 < AI < 0.50 - 17.7% of the global land area - Dry subhumid 0.50 < AI < 0.65 - 9.9% of the global land area
-
This layer represents the spatial distribution of rain measuring stations, in Namibia, that share geographical overlapping with the Okavango Basin. Source: Ministry of Agriculture, Water and Forestry of Namibia. This dataset is part of the GIS Database for the Environment Protection and Sustainable Management of the Okavango River Basin project (EPSMO). Detailed information on the database can be found in the “GIS Database for the EPSMO Project†document produced by Luis Veríssimo (FAO consultant) in July 2009, and here available for download.
-

The Thermal climates dataset, at about 9 km resolution, represents major latitudinal climatic zones based on monthly temperatures reduced to sea level. CRUTS32 as climate data source is used based on historical data for the time period 1981-2010. The Thermal climates dataset is part of the GAEZ v4 Theme 2 Agro-climatic Resources, Climate Classification sub-theme. For additional information on agro-climatic resources and indicators, please to Chapter 3 of the GAEZ v4 Model Documentation.
-
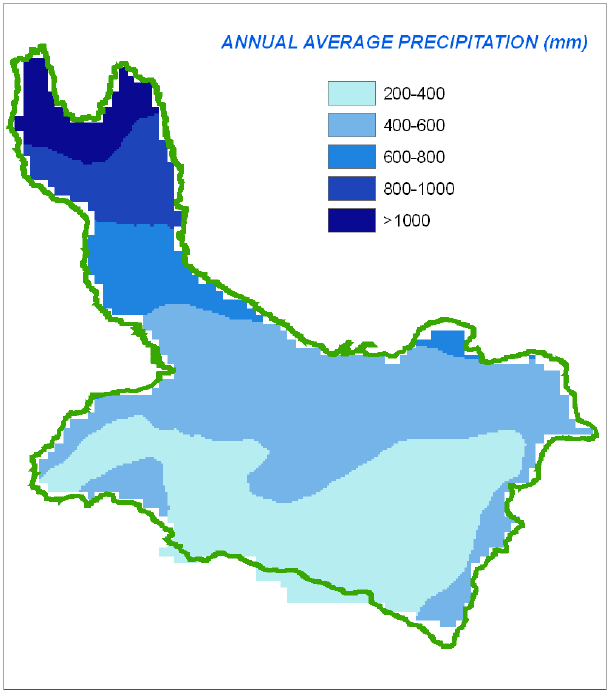
A set of 13 raster layers representing the monthly and annual, average precipitation for the Okavango Rive Basin. Source: Africa Water Resources Database (FAO). This dataset is part of the GIS Database for the Environment Protection and Sustainable Management of the Okavango River Basin project (EPSMO). Detailed information on the database can be found in the “GIS Database for the EPSMO Project†document produced by Luis Veríssimo (FAO consultant) in July 2009, and here available for download.
-
Grid with estimated yearly precipitation with a spatial resolution of 10 arc minutes. The dataset contains average values for global land areas, excluding Antarctica, for the period 1961-1990. The dataset has been prepared according to the FAO Penman - Monteith method with limited climatic data as described in FAO Irrigation and Drainage Paper 56. The dataset consists one ASCII-grid with yearly data in mm/year. ASCII-grids with mean monthly data in mm/day * 10 are also available as described in the associated resources of this metadata.
-
Grid with estimated precipitation per month with a spatial resolution of 10 arc minutes. This dataset has been constructed from 27 075 stations with 1961-1990 climatological normals. The dataset consists of 12 ASCII-grids with mean monthly data in mm/day * 10, and one ASCII-grid with yearly data in mm/year. In addition, 12 ASCII-grid with monthly values at 5 arc minutes resolution are made available as input data for a global water balance model (GlobWat).
-
Bias Correction of ERA-interim meteorological forcing dataset for Africa, based on Piani et al. (2010) for the period 1979 - 2011. Variables description Tair: air temperature (K) Tmin: minimum air temperature (K) Tmax: maximum air temperature (K) PSurf: surface pressure (Pa) Qmean: specific humidity (kg/kg) Wind: wind speed (m/s) Precip: precipitation (mm) LWdown: Downwards long-wave radiation flux (W/m-2) SWdown: Downwards short-wave radiation flux (W/m-2). This data set has been produced in the framework of the "Climate change predictions in Sub-Saharan Africa: impacts and adaptations (ClimAfrica)" project, Work Package 1 (WP1). WP1 (Past climate variability) aimed to provide consolidated data to other WPs in ClimAfrica, and to analyze the interactions between climate variability, water availability and ecosystem productivity of Sub-Saharan Africa. Various data streams that diagnose the variability of the climate, in particular the water cycle, and the productivity of ecosystems in the past decades, have been collected, analyzed and synthesized. The data streams range from ground-based observations and satellite remote sensing to model simulations. More information on ClimAfrica project is provided in the Supplemental Information section of this metadata.