 Stars4Water
GeoTIFF
Type of resources
Available actions
Topics
Keywords
Contact for the resource
Provided by
Years
Formats
Representation types
Update frequencies
status
Resolution
-

Moisture regime classification at about 9 km resolution at the equator, using different climate data source and based on different Representative Concentration Pathways (RCPs) according to the time period as follows: - climate data source CRUTS32 based on historical data for the time period 1981-2010; - climate data source ENSEMBLE based on the Representative Concentration Pathway RCP8.5 for time periods 2041-2070 and 2071-2100. The Moisture regime classification dataset is part of the GAEZ v4 Theme 1 Land and Water Resources, Agro-Ecological Zones sub-theme. The agro-ecological zones classification provides a characterization of bio-physical resources relevant to agricultural production systems. AEZ definitions and map classes follow a rigorous methodology and an explicit set of principles. The inventory combines spatial layers of thermal and moisture regimes with broad categories of soil/terrain qualities. It also indicates locations of areas with irrigated soils and shows land with severely limiting bio-physical constraints including very cold and very dry (desert) areas as well as areas with very steep terrain or very poor soil/terrain conditions. For further details, please refer to the GAEZ v4 Model Documentation.
-
This dataset is one derivative product from GAEZ v4 for year 2015 that includes gridded (5-arcminute resolution) irrigated and rainfed crop harvested area and crop yield for 26 different crops/crop categories (please see GAEZ_2015_Dimension_crops.csv for the full list). For each country, the production for each crop was extracted from the FAOSTAT database (http://www.fao.org/faostat/en/#data/QC; data downloaded April 2020). The three years average (2009-2011) of annual national crop production data was considered to represent 2010 national crop production, and the three years average (2014-2016) of annual crop production data to represent 2015 national crop production. The method for updating crop production from 2010 to 2015 was the same as described for crop harvested area, except using the 2010 national crop areas, A_(P_(m,2010))^k and the crop production ratio FP,m,i. Unit of measure Crop Production: 1000 tonnes (10e6 kg) per 5-arcminute grid cell More information about this global gridded crop harvest area, crop production, and crop yield and selected crops dataset is available in the full metadata at https://data.apps.fao.org/map/catalog/srv/eng/catalog.search#/metadata/74bab234-3a1e-442d-93cf-0b34859e9a60
-

Simplified AEZ classification (33 classes) at about 1 km resolution at the equator, using different climate data source and based on different Representative Concentration Pathways (RCPs) according to the time period as follows: - climate data source CRUTS32 based on historical data for the time period 1981-2010; - climate data source ENSEMBLE based on the Representative Concentration Pathway RCP8.5 for time periods 2041-2070 and 2071-2100. The Simplified AEZ classification dataset is part of the GAEZ v4 Theme 1 Land and Water Resources, Agro-Ecological Zones sub-theme. The agro-ecological zones classification provides a characterization of bio-physical resources relevant to agricultural production systems. AEZ definitions and map classes follow a rigorous methodology and an explicit set of principles. The inventory combines spatial layers of thermal and moisture regimes with broad categories of soil/terrain qualities. It also indicates locations of areas with irrigated soils and shows land with severely limiting bio-physical constraints including very cold and very dry (desert) areas as well as areas with very steep terrain or very poor soil/terrain conditions. For further details, please refer to the GAEZ v4 Model Documentation.
-

Theme 4 presents results of the final step in the GAEZ crop suitability and productivity assessment, combining agro-climatic potential yields with soil/terrain evaluation results, i.e., yield reduction factors due to the constraints induced by soil limitations and prevailing terrain-slope conditions. Grid cells of the resource inventory can be made up of multiple soil types and terrain slope classes. GAEZ determines for each grid cell the respective characteristics of land units in terms of soil types and slope classes. Each of these component land units is separately assessed and assigned a suitability rating and simulated potential yield. The values are accumulated over all component land units in a grid cell, which produces a distribution of results falling into different suitability classes: very suitable (VS), suitable (S), moderately suitable (MS), marginally suitable (mS), very marginally suitable (vmS) and not suitable (NS). This theme provides information for 53 crops and includes sub-themes on: (1) Suitability Class, (2) Suitability Index, (3) Agro-ecological Attainable Yield, and (4) Crop Water Indicators. GAEZ methodology development, data base compilation, production of results and establishing the Data Portal were accomplished in close technical collaboration and with inputs of the International Institute for Applied Systems Analysis (IIASA). For further details, please refer to the GAEZ v4 Model Documentation.
-

Classification by thermal climates and thermal zones dataset at about 9 km resolution at the equator. CRUTS32 as climate data source is used based on historical data for the time period 1981-2010. The Classification by thermal climates and thermal zones dataset is part of the GAEZ v4 Theme 2 Agro-climatic Resources - Climate Classification sub-theme. For additional information on agro-climatic resources and indicators, please to Chapter 3 of the GAEZ v4 Model Documentation.
-
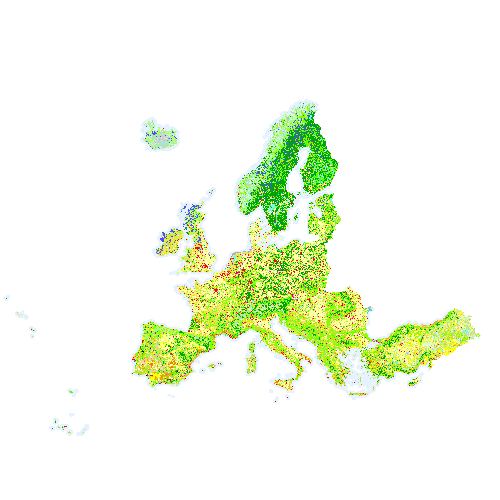
Corine Land Cover 2018 (CLC2018) is one of the Corine Land Cover (CLC) datasets produced within the frame the Copernicus Land Monitoring Service referring to land cover / land use status of year 2018. CLC service has a long-time heritage (formerly known as "CORINE Land Cover Programme"), coordinated by the European Environment Agency (EEA). It provides consistent and thematically detailed information on land cover and land cover changes across Europe. CLC datasets are based on the classification of satellite images produced by the national teams of the participating countries - the EEA members and cooperating countries (EEA39). National CLC inventories are then further integrated into a seamless land cover map of Europe. The resulting European database relies on standard methodology and nomenclature with following base parameters: 44 classes in the hierarchical 3-level CLC nomenclature; minimum mapping unit (MMU) for status layers is 25 hectares; minimum width of linear elements is 100 metres. Change layers have higher resolution, i.e. minimum mapping unit (MMU) is 5 hectares for Land Cover Changes (LCC), and the minimum width of linear elements is 100 metres. The CLC service delivers important data sets supporting the implementation of key priority areas of the Environment Action Programmes of the European Union as e.g. protecting ecosystems, halting the loss of biological diversity, tracking the impacts of climate change, monitoring urban land take, assessing developments in agriculture or dealing with water resources directives. CLC belongs to the Pan-European component of the Copernicus Land Monitoring Service (https://land.copernicus.eu/), part of the European Copernicus Programme coordinated by the European Environment Agency, providing environmental information from a combination of air- and space-based observation systems and in-situ monitoring. Additional information about CLC product description including mapping guides can be found at https://land.copernicus.eu/user-corner/technical-library/. CLC class descriptions can be found at https://land.copernicus.eu/user-corner/technical-library/corine-land-cover-nomenclature-guidelines/html/.
-

The Koeppen-Geiger climate classification is based on a subdivision of terrestrial climates into five major types, which are represented by the capital letters A (tropical), B (dry), C (temperate), D (cold), and E (polar). Each of these climate types, except for B, is defined by temperature criteria. Type B designates climates in which the controlling factor on vegetation is dryness (rather than coldness). Dry climates are divided into arid (BW) and semi-arid (BS) subtypes. Other climate types are sub-divided according to seasonal precipitation characteristics. The level-2 classification distinguishes 14 classes. CRUTS32 as climate data source is used based on historical data for the time period 1981-2010. The Koeppen-Geiger climate classification dataset is part of the GAEZ v4 Theme 2 Agro-climatic Resources, Climate Classification sub-theme. For additional information on agro-climatic resources and indicators, please to Chapter 3 of the GAEZ v4 Model Documentation.
-

The Thermal zones dataset, at about 9 km resolution, reflects actual monthly temperature conditions throughout the year and serve as input to crop suitability assessment. CRUTS32 as climate data source is used based on historical data for the time period 1981-2010. The Thermal zones dataset is part of the GAEZ v4 Theme 2 Agro-climatic Resources, Climate Classification sub-theme. For additional information on agro-climatic resources and indicators, please to Chapter 3 of the GAEZ v4 Model Documentation.
-

Average attainable yield of current cropland for wheat, cotton and sugarcane under irrigated conditions and high input level, with and without CO2 fertilization, using different climate data source and based on different Representative Concentration Pathways (RCPs) according to the time period as follows: - climate data source CRUTS32 based on historical data for the time period 1981-2010; - climate data source ENSEMBLE based on the Representative Concentration Pathway RCP8.5 for time period 2041-2070. The Average attainable yield of current cropland dataset is part of the GAEZ v4 Suitability and Attainable Yield - Agro-Ecological Attainable Yield. For additional information, please refer to the GAEZ v4 Model Documentation.
-
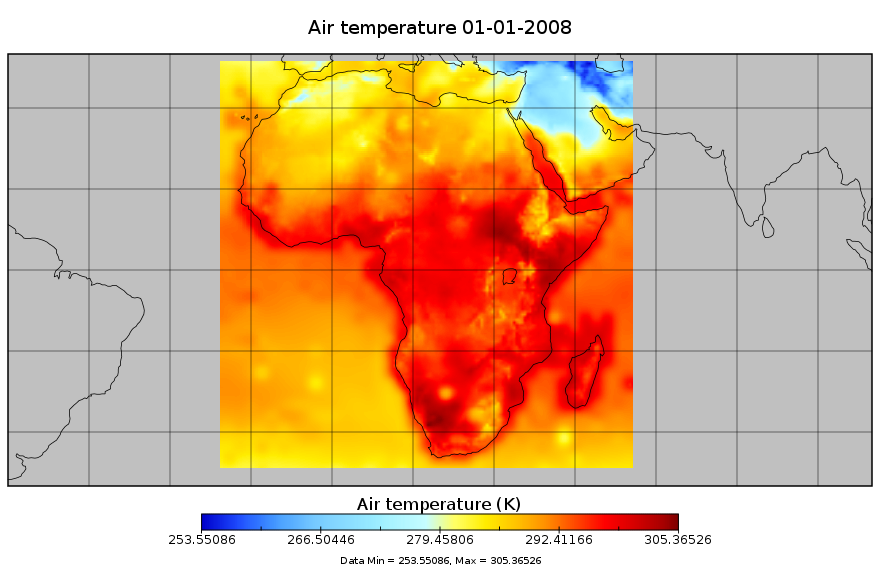
Bias-corrected and downscaled future climate meterological forcing data for Africa, for the period 1948-2099. This dataset is derived from the Global Meteorological Forcing Dataset for Land Surface Modeling, produced by the Princeton University [Department of Civil and Environmental Engineering]. The source data is a 150-yr (1948-2099) dataset of meteorological forcings for driving land surface models and other land modeling schemes. It is derived by bias correcting and downscaling WCRP CMIP3 climate model data for the 20th century and 21st century future climate projections. The dataset is bias-corrected and downscaled using the newly developed equidistant quantile matching method (Li et al., 2010) which better represents changes in the full distribution (not just the mean change). In addition to precipitation and temperature, radiation, humidity, pressure and windspeed are also downscaled. The downsclaing is based on the observational based global forcing dataset of Sheffield et al. (2006) also available from this website. The dataset is currently available at 1.0 degree, 3-hourly resolution globally for 1948-2008. Experimental versions include a 1901-2008 version, real-time updates, higher resolution versions at 0.25deg and 0.5deg and future climate projections based on bias-corrected climate model output. The data are currently available for one climate model (NCAR-PCM1) for the 20th century historical forcing (20C3M; 1948-2000) and one future climate scenario (SRES A2; 2001-2099). This work was supported by NSF Project 0629471 "Collaborative research: Understanding change in the climate and hydrology of the Arctic land region: Synthesizing the results of the ARCSS Fresh Water Initiative Projects". Variables description Tair: 2 m air temperature (K) PSurf: 2 m surface pressure (Pa) Qair: specific humidity (kg/kg) Wind: 10m wind speed (m/s) Precip: precipitation (mm) LWdown: Downwards long-wave radiation flux (W/m-2) LWnet: Net short-wave radiation flux (W/m-2) SWdown: Downwards short-wave radiation flux (average) (W/m-2) This data set has been produced for driving land surface models and other land modeling schemes, in the framework of the "Climate change predictions in Sub-Saharan Africa: impacts and adaptations (ClimAfrica)" project, Work Package 1 (WP1).