 Stars4Water
2013
Type of resources
Available actions
Topics
Keywords
Contact for the resource
Provided by
Years
Formats
Representation types
Update frequencies
status
Resolution
-
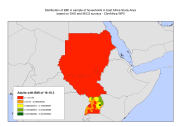
Vulnerable population identified by the nutritional status of women (BMI) as indicator for food security, in sample of households in East Africa study area. Data based on DHS and MICS surveys. In defining vulnerability, WFP (2009) and IFPRI (2012) have been followed and combined with indicators for food security with health indicators that signal vulnerability in a physical sense. IFPRI's Global Hunger Index uses three indicators to measure hunger: the number of adults being undernourished, the number of children that have low weight for age, and child mortality. Other classifications of food security use the variety of the diet as an indicator, combined with anthropometric data on children. However, in the DHS data there were no information available on child mortality, nor on dietary composition. Given these data limitations, data on nutritional status of women (Body Mass Index, BMI) for women and children (weight for age) have been used as indicators for food security. These data were combined with data on morbidity among adults and children, specifically the occurrence of malaria, cough, and diarrhea. Combinations of indicators have led to a classification of households as being very vulnerable, vulnerable, nearly vulnerable and not vulnerable. This data set was produced in the framework of the "Climate change predictions in Sub-Saharan Africa: impacts and adaptations (ClimAfrica)" project, Work Package 5 (WP5). More information on ClimAfrica project is provided in the Supplemental Information section of this metadata. This study in WP5 aimed to identify, locate and characterize groups that are vulnerable for climate change conditions in two country clusters; one in West Africa (Benin, Burkina Faso, Côte d'Ivoire, Ghana, and Togo) and one in East Africa (Sudan, South Sudan and Uganda). Data used for the study include the Demographic and Health Surveys (DHS) , the Multi Indicator Cluster Survey (MICS) and the Afrobarometer surveys for the socio-economic variables and grid level data on agro-ecological and climatic conditions.
-
The International Hydrogeological Map of Europe 1:1,500,000 constitutes the only coherent general map of groundwater resources throughout Europe. Groundwater is distinguished according to productivity, aquifer rock type (porous or fissured rocks) and lithology of water-bearing strata. Moreover the map series includes the position of relevant tectonic fractures.
-
The Database for Hydrological Time Series of Inland Waters (DAHITI) provides hydrologial information on lakes, reservoirs, rivers, and wetlands derived from satellite data.
-
Vulnerable population identified by prevalence of diseases indicator in East Africa - ClimAfrica WP5
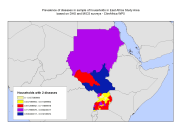
Vulnerable population identified by the prevalence of diseases (malaria, cough and diarrhea) as indicator for food security, in sample of households in East Africa study area. Data based on DHS and MICS surveys. In defining vulnerability, WFP (2009) and IFPRI (2012) have been followed and combined with indicators for food security with health indicators that signal vulnerability in a physical sense. IFPRI's Global Hunger Index uses three indicators to measure hunger: the number of adults being undernourished, the number of children that have low weight for age, and child mortality. Other classifications of food security use the variety of the diet as an indicator, combined with anthropometric data on children. However, in the DHS data there were no information available on child mortality, nor on dietary composition. Given these data limitations, data on nutritional status of women (Body Mass Index, BMI) for women and children (weight for age and weight for height) have been used as indicators for food security. These data were combined with data on morbidity among adults and children, specifically the occurrence of malaria, cough, and diarrhea. Combinations of indicators have led to a classification of households as being very vulnerable, vulnerable, nearly vulnerable and not vulnerable. This data set was produced in the framework of the "Climate change predictions in Sub-Saharan Africa: impacts and adaptations (ClimAfrica)" project, Work Package 5 (WP5). More information on ClimAfrica project is provided in the Supplemental Information section of this metadata. This study in WP5 aimed to identify, locate and characterize groups that are vulnerable for climate change conditions in two country clusters; one in West Africa (Benin, Burkina Faso, Côte d'Ivoire, Ghana, and Togo) and one in East Africa (Sudan, South Sudan and Uganda). Data used for the study include the Demographic and Health Surveys (DHS) , the Multi Indicator Cluster Survey (MICS) and the Afrobarometer surveys for the socio-economic variables and grid level data on agro-ecological and climatic conditions.
-
Global Urban Heat Island (UHI) Data Set
-
DLR Map of Human Settlements based on SAR data
-
Vulnerable population identified by prevalence of diseases indicator in West Africa - ClimAfrica WP5
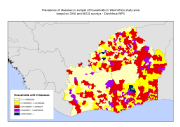
Vulnerable population identified by the prevalence of diseases (malaria, cough and diarrhea) as indicator for food security, in sample of households in West Africa study area. Data based on DHS and MICS surveys. In defining vulnerability, WFP (2009) and IFPRI (2012) have been followed and combined with indicators for food security with health indicators that signal vulnerability in a physical sense. IFPRI's Global Hunger Index uses three indicators to measure hunger: the number of adults being undernourished, the number of children that have low weight for age, and child mortality. Other classifications of food security use the variety of the diet as an indicator, combined with anthropometric data on children. However, in the DHS data there were no information available on child mortality, nor on dietary composition. Given these data limitations, data on nutritional status of women (Body Mass Index, BMI) for women and children (weight for age and weight for height) have been used as indicators for food security. These data were combined with data on morbidity among adults and children, specifically the occurrence of malaria, cough, and diarrhea. Combinations of indicators have led to a classification of households as being very vulnerable, vulnerable, nearly vulnerable and not vulnerable. This data set was produced in the framework of the "Climate change predictions in Sub-Saharan Africa: impacts and adaptations (ClimAfrica)" project, Work Package 5 (WP5). More information on ClimAfrica project is provided in the Supplemental Information section of this metadata. This study in WP5 aimed to identify, locate and characterize groups that are vulnerable for climate change conditions in two country clusters; one in West Africa (Benin, Burkina Faso, Côte d'Ivoire, Ghana, and Togo) and one in East Africa (Sudan, South Sudan and Uganda). Data used for the study include the Demographic and Health Surveys (DHS) , the Multi Indicator Cluster Survey (MICS) and the Afrobarometer surveys for the socio-economic variables and grid level data on agro-ecological and climatic conditions.
-
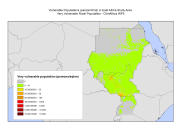
In defining vulnerability, WFP (2009) and IFPRI (2012) have been followed and combined with indicators for food security with health indicators that signal vulnerability in a physical sense. IFPRI's Global Hunger Index uses three indicators to measure hunger: the number of adults being undernourished, the number of children that have low weight for age, and child mortality. Other classifications of food security use the variety of the diet as an indicator, combined with anthropometric data on children. However, in the DHS data there were no information available on child mortality, nor on dietary composition. Given these data limitations, data on nutritional status of women (Body Mass Index, BMI) for women and children (weight for age) have been used as indicators for food security. These data were combined with data on morbidity among adults and children, specifically the occurrence of malaria, cough, and diarrhea. Combinations of indicators have led to a classification of households as being very vulnerable, vulnerable, nearly vulnerable and not vulnerable. The Afrobarometer surveys did not include data on the BMI of adults nor weights for children. Here, the reported times the household went without food in the year were used prior to the date the survey was conducted as vulnerability indicator. The study area of households vulnerability included: rural, urban and total population. This data set was produced in the framework of the "Climate change predictions in Sub-Saharan Africa: impacts and adaptations (ClimAfrica)" project, Work Package 5 (WP5). More information on ClimAfrica project is provided in the Supplemental Information section of this metadata. This study in WP5 aimed to identify, locate and characterize groups that are vulnerable for climate change conditions in two country clusters; one in West Africa (Benin, Burkina Faso, Côte d'Ivoire, Ghana, and Togo) and one in East Africa (Sudan, South Sudan and Uganda). Data used for the study include the Demographic and Health Surveys (DHS) , the Multi Indicator Cluster Survey (MICS) and the Afrobarometer surveys for the socio-economic variables and grid level data on agro-ecological and climatic conditions.
-
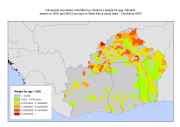
Vulnerable population identified by the nutritional status of children (weight for age and weight for height) as indicators for food security, in sample of households in West Africa study area. Data based on DHS and MICS surveys. In defining vulnerability, WFP (2009) and IFPRI (2012) have been followed and combined with indicators for food security with health indicators that signal vulnerability in a physical sense. IFPRI's Global Hunger Index uses three indicators to measure hunger: the number of adults being undernourished, the number of children that have low weight for age, and child mortality. Other classifications of food security use the variety of the diet as an indicator, combined with anthropometric data on children. However, in the DHS data there were no information available on child mortality, nor on dietary composition. Given these data limitations, data on nutritional status of women (Body Mass Index, BMI) for women and children (weight for age and weight for height) have been used as indicators for food security. These data were combined with data on morbidity among adults and children, specifically the occurrence of malaria, cough, and diarrhea. Combinations of indicators have led to a classification of households as being very vulnerable, vulnerable, nearly vulnerable and not vulnerable. This data set was produced in the framework of the "Climate change predictions in Sub-Saharan Africa: impacts and adaptations (ClimAfrica)" project, Work Package 5 (WP5). More information on ClimAfrica project is provided in the Supplemental Information section of this metadata. This study in WP5 aimed to identify, locate and characterize groups that are vulnerable for climate change conditions in two country clusters; one in West Africa (Benin, Burkina Faso, Côte d’Ivoire, Ghana, and Togo) and one in East Africa (Sudan, South Sudan and Uganda). Data used for the study include the Demographic and Health Surveys (DHS) , the Multi Indicator Cluster Survey (MICS) and the Afrobarometer surveys for the socio-economic variables and grid level data on agro-ecological and climatic conditions.
-
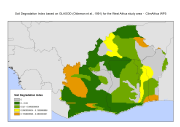
The soil degradation index is based on the Global Assessment of Human-induced Soil Degradation (GLASOD) (Oldeman et al., 1991). The UNEP-funded GLASOD project produced a world map of human-induced soil degradation. Data were compiled in cooperation with a large number of soil scientists throughout the world, using uniform guidelines and international correlation. The status of soil degradation was mapped within physiographic units, based on expert judgments, indicating the type, extent, degree, rate and main causes of the degradation process. To compare the impact of land degradation between different sites we created a land degradation index that attributes the following weights to area shares of the soil degradation classes 'light'= 1, 'moderate'=2, 'severe' = 3 and 'very severe' = 4. Next, we scaled the index between a range of 0-1. Combining classes and area shares in a single land degradation index is common practice in many other peer reviewed studies (e.g. Leiwen et al., 2005; McCoubrey, 1998; Pace at al., 2008; Safriel, 1999; Sonneveld and Dent, 2009), which gives us, sufficient confidence to apply the index for our analysis. This dataset has been used to complement the survey data and included in the ''Climate change predictions in Sub-Saharan Africa: impacts and adaptations (ClimAfrica)'' project, Work Package 5 (WP5). More information on ClimAfrica project is provided in the Supplemental Information section of this metadata. This study in WP5 aimed to identify, locate and characterize groups that are vulnerable for climate change conditions in two country clusters; one in West Africa (Benin, Burkina Faso, Côte d'Ivoire, Ghana, and Togo) and one in East Africa (Sudan, South Sudan and Uganda). Data used for the study include the Demographic and Health Surveys (DHS) , the Multi Indicator Cluster Survey (MICS) and the Afrobarometer surveys for the socio-economic variables and grid level data on agro-ecological and climatic conditions.