 Stars4Water
2025
Type of resources
Topics
Keywords
Contact for the resource
Provided by
Years
Formats
Representation types
Update frequencies
status
Scale
-
The data entails a set of indicators for assessing climate risks and impacts on integrated water resources systems. This first tier is a set of indicators that are directly derived from readily available datasets from e.g. the Copernicus Climate Data Store.
-
Precipitation deficit is a common measure for severity of agricultural drought, for example in the Netherlands, but it is also used internationally (Narasimhan, 2005). The precipitation deficit addresses the need for drought monitoring, which was expressed by several river basins, including the Drammen, East Anglia and Danube (Hegdahl, 2023).
-
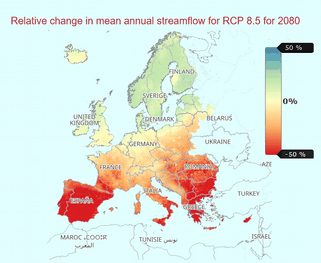
The dataset provides a number of indicators of the potential change, relative to a reference period of the recent past, in hydrological conditions over the 21st Century based on an ensemble of climate and hydrological models. The indicators cover hydrological variables of river discharge, soil moisture, snow water equivalent and groundwater recharge. These indicators are produced by various hydrological models using input variables of historical and projected precipitation, temperature and potential evapotranspiration. The indicators transform data from climate projections into usable information for the European water sector. They were defined in discussion with stakeholder groups working in different areas of the water sector (hydropower, irrigation, water supply) to provide clear information on climate projections for water resources as annual, seasonal and monthly change factors for a range of variables. A range of global climate models and standard projection scenarios (based on latest Copernicus Climate Change Service and Coupled Model Inter-comparison Project Phase 5 climate modelling experiments) were used along a multi-hydrological model approach to produce these indicators. This ensemble approach to the climate and hydrological modelling captures the uncertainty and variability of the hydrological regime. Precipitation and temperature data from five global climate models was downscaled to 5km x 5km resolution with the daily values disaggregated to 3-hourly values. These data were used to force four hydrological models to produce the hydrological variables to derive the indicators. The indicators are given as relative changes for a given 30-year projection window with respect to the reference period estimates of 1971-2010 for Representative Concentration Pathways (RCP) 2.6 and 8.5, for each grid cell. This dataset is produced on behalf of Copernicus Climate Change Service, by UK Centre for Ecology & Hydrology (UKCEH), Helmholtz Centre for Environmental Research (UFZ), Leipzig, Centro Tecnológico del Agua (Cetaqua), Climate Partnership LLC (CPL), Environment Agency (EA), Mediterranean Network of Basin Organisations (MENBO), Norwegian Water Resources & Energy Directorate (NVE).
-
This dataset provides water variables and indicators based on hydrological impact modelling, forced by bias adjusted regional climate simulations from the European Coordinated Regional Climate Downscaling Experiment (EURO-CORDEX). The dataset contains Essential Climate Variable (ECV) data in the form of daily mean river discharge and a set of climate impact indicators (CIIs) for both water quantity and quality. ECV datasets provide the empirical evidence needed to understand the current climate and predict future changes. CIIs contain condensed climate information which facilitate relatively quick and efficient subsequent analysis. Therefore, CIIs make climate information accessible to application focussed users within a sector. The ECVs and CIIs provided here were derived within the water management sectoral information service to address questions specific to the water sector. However, the products are provided in a generic form and are relevant for a range of sectors, for example agriculture and energy. The data represent the current state-of-the-art in Europe for regional climate and hydrological modelling and indicator production. Eight bias adjusted model simulations from the EURO-CORDEX EUR-11 were used to force a multi-model setup of the hydrological model E-HYPEcatch at a pan-European domain. A total of 18 water quality and quantity CIIs and 1 water ECV are provided in this dataset at catchment scale and on a 5km x 5km grid. The CIIs are provided as mean values over a 30-year time period. For the reference period (1971-2000) data is provided as absolute values, for the future periods the data is provided as absolute values and as the relative or absolute change from the reference period. The future periods cover 3 fixed time periods (2011-2040, 2041-2070 and 2071-2100) and 3 "degree scenario" periods defined by when global warming exceeds a given threshold (1.5 °C, 2.0 °C and 3.0 °C). The global warming is calculated from the global climate model (GCM) used, therefore the actual time period of the degree scenarios will be different for each GCM. The river discharge ECV data meet the technical specification set by the Global Climate Observing System (GCOS), as such they are provided on a daily time step. Note these are model output data, not observation data as is the general case for ECVs. This dataset is produced and quality assured by the Swedish Meteorological and Hydrological Institute on behalf of the Copernicus Climate Change Service.