 Stars4Water
200000
Type of resources
Available actions
Topics
Keywords
Contact for the resource
Provided by
Years
Formats
Representation types
Update frequencies
status
Scale
-

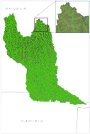
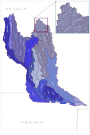
This vector layer (line) – reference scale 1/200 000 – is a drainage network model of the CORB-Contributing area. In the attributes table, each drainage line is linked to the micro catchment in which it resides. The creation of this layer was achieved by converting the Steam Segmentation grid layer into vector layer. This dataset is part of the GIS Database for the Environment Protection and Sustainable Management of the Okavango River Basin project (EPSMO). Detailed information on the database can be found in the “GIS Database for the EPSMO Project†document produced by Luis Veríssimo (FAO consultant) in July 2009, and here available for download.
-
This vector layer (point) represents the points at which stream segments intersect in the CORB-Contributing area, and can aid in the identified of locations for potential hydrological monitoring. This was created by an interpolation of all stream intersections in the Drainage Line layer. This dataset is part of the GIS Database for the Environment Protection and Sustainable Management of the Okavango River Basin project (EPSMO). Detailed information on the database can be found in the “GIS Database for the EPSMO Project†document produced by Luis Veríssimo (FAO consultant) in July 2009, and here available for download.
-
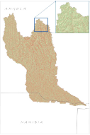
This vector layer (polygon) - reference scale 1/200 000 - also identifies the catchment area for each stream segment in the CORB-Contributing area. The value for each polygon corresponds to the value carried by the stream segment that drains that area, defined in the Stream Segmentation grid. Source: This layer was created by converting the Catchment Grid raster layer into vector format. This dataset is part of the GIS Database for the Environment Protection and Sustainable Management of the Okavango River Basin project (EPSMO). Detailed information on the database can be found in the “GIS Database for the EPSMO Project†document produced by Luis Veríssimo (FAO consultant) in July 2009, and here available for download.
-
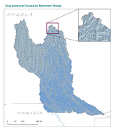
This vector layer (line) – reference scale 1/200 000 – is a infered sub-surface drainage network model of the CORB-Contributing area. In the attributes table, each drainage line is linked to the micro catchment in which it resides. The creation of this layer was achieved by filtering the Drainage Network model with the Surface Drainage Network model. This dataset is part of the GIS Database for the Environment Protection and Sustainable Management of the Okavango River Basin project (EPSMO). Detailed information on the database can be found in the “GIS Database for the EPSMO Project†document produced by Luis Veríssimo (FAO consultant) in July 2009, and here available for download.
-
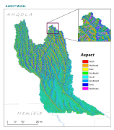
This raster layer represents the aspect model of the CORB-Contributing area, in the reference scale of 1/200 000. Aspect is the direction that a slope faces. It identifies the steepest downslope direction at a location on a surface. Source: The creation of this layer was achieved by interpolating the DTM raster layer. This dataset is part of the GIS Database for the Environment Protection and Sustainable Management of the Okavango River Basin project (EPSMO). Detailed information on the database can be found in the “GIS Database for the EPSMO Project†document produced by Luis Veríssimo (FAO consultant) in July 2009, and here available for download.
-
This vector layer (polygon) – reference scale 1/200 000 – is a sub-basin delineation of the CORB-Contributing area, incorporating basins of the main tributaries and sub- tributaries of the Kubango/Okavango river. It was created by a supervised aggregation of micro basin units from the Catchment MicroBasins layer. This dataset is part of the GIS Database for the Environment Protection and Sustainable Management of the Okavango River Basin project (EPSMO). Detailed information on the database can be found in the “GIS Database for the EPSMO Project†document produced by Luis Veríssimo (FAO consultant) in July 2009, and here available for download.
-
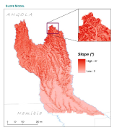
This raster layer represents the slope model of the CORB-Contributing area, in the reference scale of 1/200 000. The creation of this layer was achieved by interpolating the DTM raster layer. Units are organized by degrees. This dataset is part of the GIS Database for the Environment Protection and Sustainable Management of the Okavango River Basin project (EPSMO). Detailed information on the database can be found in the “GIS Database for the EPSMO Project†document produced by Luis Veríssimo (FAO consultant) in July 2009, and here available for download.
-

This vector layer (line) – reference scale 1/200 000 – is a drainage network model of the CORB-Contributing area. In the attributes table, each drainage line is linked to the micro catchment in which it resides. The creation of this layer was achieved by filtering the Drainage Network model with visual analyses of topographic maps and DTM model. This dataset is part of the GIS Database for the Environment Protection and Sustainable Management of the Okavango River Basin project (EPSMO). Detailed information on the database can be found in the “GIS Database for the EPSMO Project†document produced by Luis Veríssimo (FAO consultant) in July 2009, and here available for download.
-
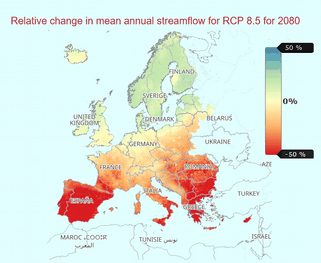
The dataset provides a number of indicators of the potential change, relative to a reference period of the recent past, in hydrological conditions over the 21st Century based on an ensemble of climate and hydrological models. The indicators cover hydrological variables of river discharge, soil moisture, snow water equivalent and groundwater recharge. These indicators are produced by various hydrological models using input variables of historical and projected precipitation, temperature and potential evapotranspiration. The indicators transform data from climate projections into usable information for the European water sector. They were defined in discussion with stakeholder groups working in different areas of the water sector (hydropower, irrigation, water supply) to provide clear information on climate projections for water resources as annual, seasonal and monthly change factors for a range of variables. A range of global climate models and standard projection scenarios (based on latest Copernicus Climate Change Service and Coupled Model Inter-comparison Project Phase 5 climate modelling experiments) were used along a multi-hydrological model approach to produce these indicators. This ensemble approach to the climate and hydrological modelling captures the uncertainty and variability of the hydrological regime. Precipitation and temperature data from five global climate models was downscaled to 5km x 5km resolution with the daily values disaggregated to 3-hourly values. These data were used to force four hydrological models to produce the hydrological variables to derive the indicators. The indicators are given as relative changes for a given 30-year projection window with respect to the reference period estimates of 1971-2010 for Representative Concentration Pathways (RCP) 2.6 and 8.5, for each grid cell. This dataset is produced on behalf of Copernicus Climate Change Service, by UK Centre for Ecology & Hydrology (UKCEH), Helmholtz Centre for Environmental Research (UFZ), Leipzig, Centro Tecnológico del Agua (Cetaqua), Climate Partnership LLC (CPL), Environment Agency (EA), Mediterranean Network of Basin Organisations (MENBO), Norwegian Water Resources & Energy Directorate (NVE).
-

Complete set of 27 (500k) and 8 (200k) medium scale topographic maps, that share geographical overlapping with the Okavango Basin. Source: International Russian topo maps georeferenced under the GIS EPSMO program. This dataset is part of the GIS Database for the Environment Protection and Sustainable Management of the Okavango River Basin project (EPSMO). Detailed information on the database can be found in the “GIS Database for the EPSMO Project†document produced by Luis Veríssimo (FAO consultant) in July 2009, and here available for download.