 Stars4Water
Deltares
Type of resources
Topics
Keywords
Contact for the resource
Provided by
Years
Formats
Representation types
Update frequencies
status
Scale
-
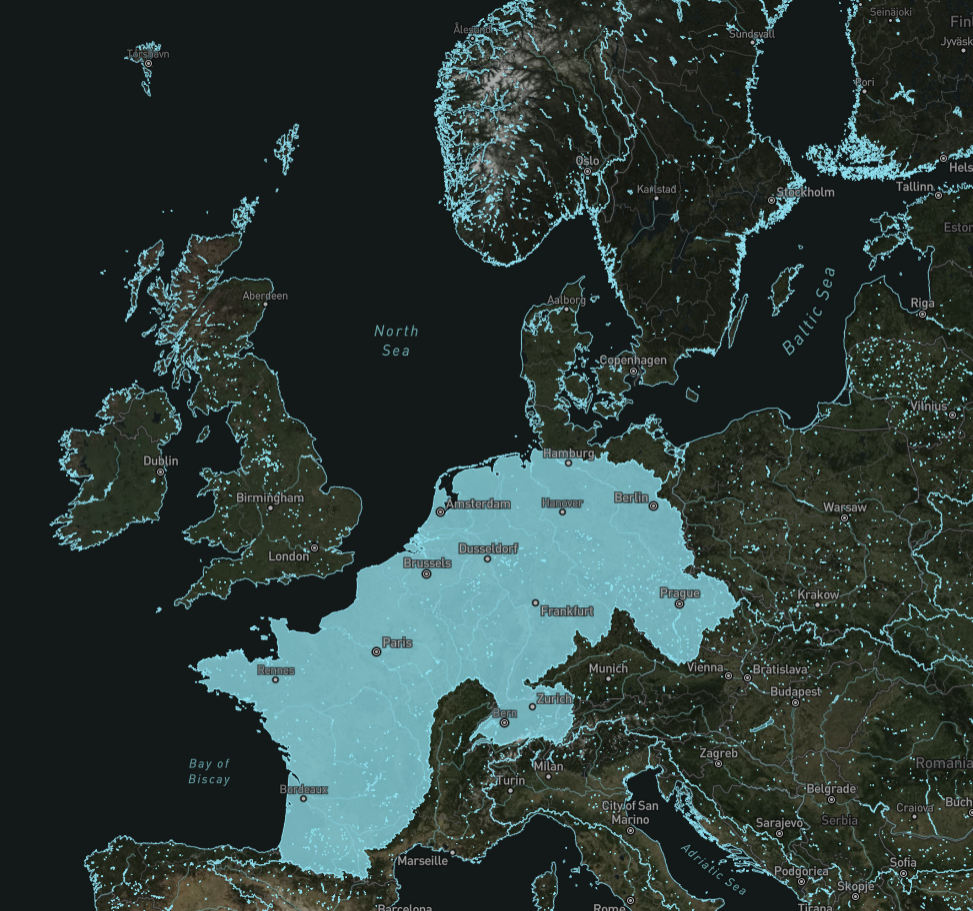
Climate change and growing pressure on natural resources are existential threats to both humanity and nature. These threats require ambitious responses. Increasing water risks have led to more attention on water-related threats. While demand for water has risen sharply in many regions of the world, as a result of population growth and economic expansion, climate change is expected to decrease water supply, alter the timing of water availability, and increase the severity of droughts and floods. These growing pressures on water resources undermine water security and contribute to conflict, migration, health crises, and food and energy insecurity across the world. Data on global water resources is essential for managing these growing risks and challenges. Global Water Watch, supported by Google.org and the Water, Peace, and Security Partnership, will provide free, globally accessible, near-real-time information on water. Deltares, World Resources Institute (WRI), and World Wildlife Fund (WWF) are partnering to create the data platform, which will house information on over 70,000 global reservoirs and major river systems, derived using satellite data, machine learning, and cloud computing. This data will help decision-makers respond to extreme weather events, manage growing risks of climate change, make societies more climate resilient, and preserve and restore our vital ecosystems and the many services they provide.
-
Yearly data on freshwater resources, water abstraction and use are collected annually by means of the RWQ Eurostat Regional Water Questionnaire. Data aggregation: RBD (River basin districts according to the Water Framework Directive, 2000/60/EC) and their subunits. The classifications are made according to the definitions of the RWQ (Regional Water Questionnaire). NACE Eurostat strives for further harmonisation with reporting frameworks under current/future European legislation, such as the Urban Wastewater treatment Directive (91/271/EEC) or the Water Framework Directive (2000/60/EC). Collection and compilation of annual data on a diversity of topics, comprising the following data sets for every RBD/SU: Renewable fresh water resources; Annual fresh water abstraction by source and by sector and other sources of water (marine and brackish water, desalinated water, reused water); Regional water transfers; Water losses; Water use;
-
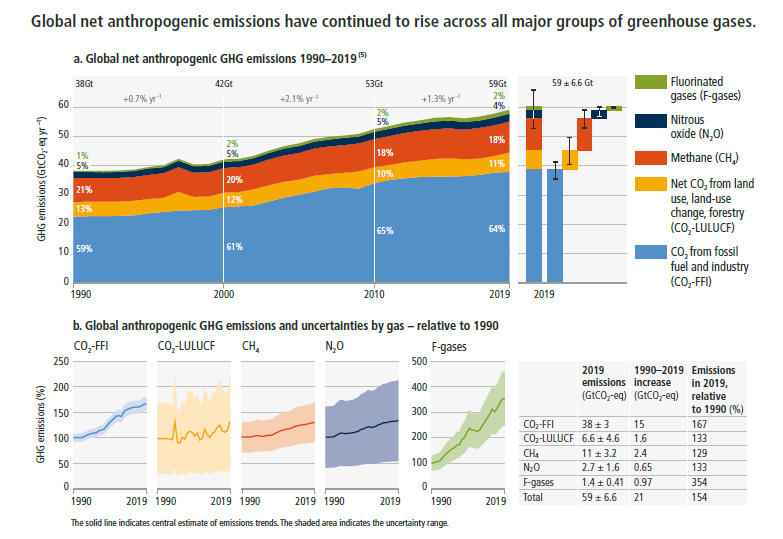
As part of the IPCC's Sixth Assessment Report (AR6), authors from Working Group III on Mitigation of Climate Change undertook a comprehensive exercise to collect and assess quantitative, model-based scenarios related to the mitigation of climate change. Building on previous assessments, such as those undertaken for the Fifth Assessment Report (AR5) and the Special Report on Global Warming of 1.5°C (SR15), the calls for scenarios in AR6 have been expanded to include energy, emissions, and sectoral scenarios from global to national scales, thus more broadly supporting the assessment across multiple chapters (see Annex III, Part 2 of the WG III Report and the About tab for more details). The compilation and assessment of the scenario ensemble was conducted by authors of the IPCC AR6 report, and the resource is hosted by the International Institute for Applied Systems Analysis (IIASA) as part of a cooperation agreement with Working Group III of the IPCC. The scenario ensemble contains 3,131 quantitative scenarios with data on socio-economic development, greenhouse gas emissions, and sectoral transformations across energy, land use, transportation and industry. These scenarios derive from 188 unique modelling frameworks and 95+ model families that are either globally comprehensive, national, multi-regional or sectoral. The criteria for submission included that the scenario is presented in a peer-reviewed journal accepted for publication no later than October 11th, 2021, or published in a report determined by the IPCC to be eligible grey literature by the same date.
-
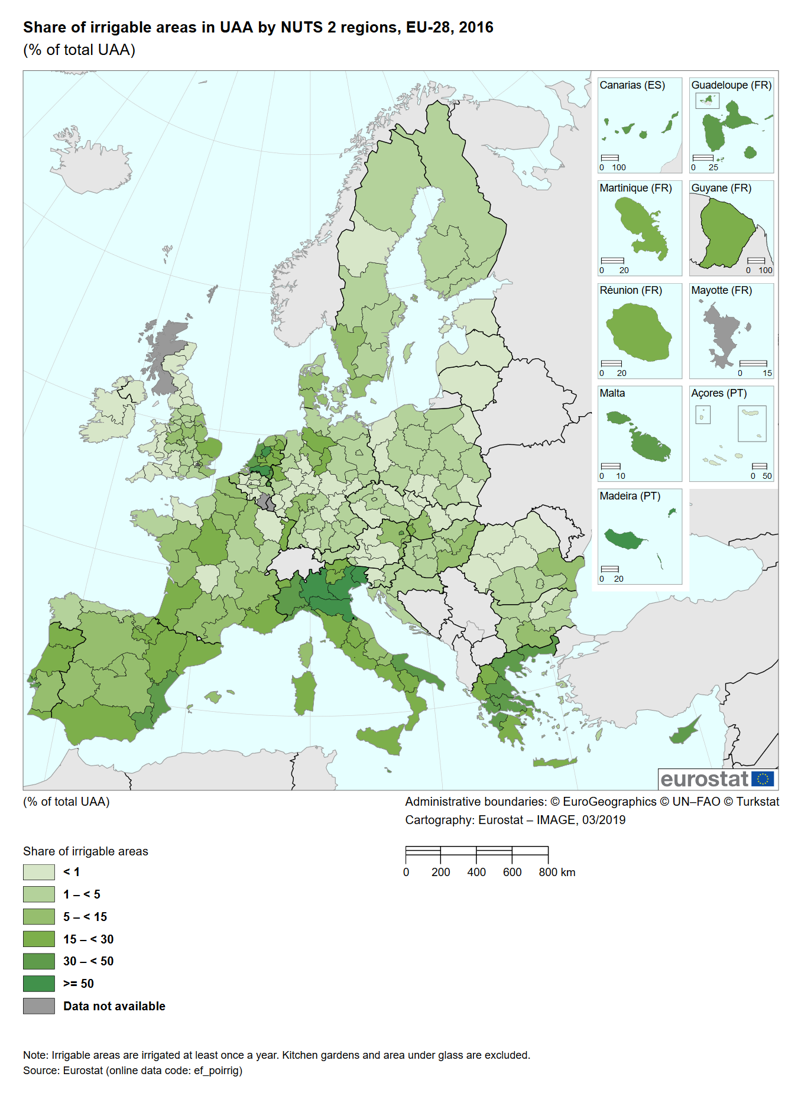
The indicator assesses the trend of the irrigable and irrigated areas and their share of the total utilised agricultural area (UAA). The irrigable area is the area which is equipped for irrigation. This area does not show so much variation from year to year as it is costly for the farmer to invest in irrigation equipment. The irrigated area measures the actual amount of land irrigated and can vary significantly from year to year due to, for instance, meteorological conditions or the choice of crop.
-
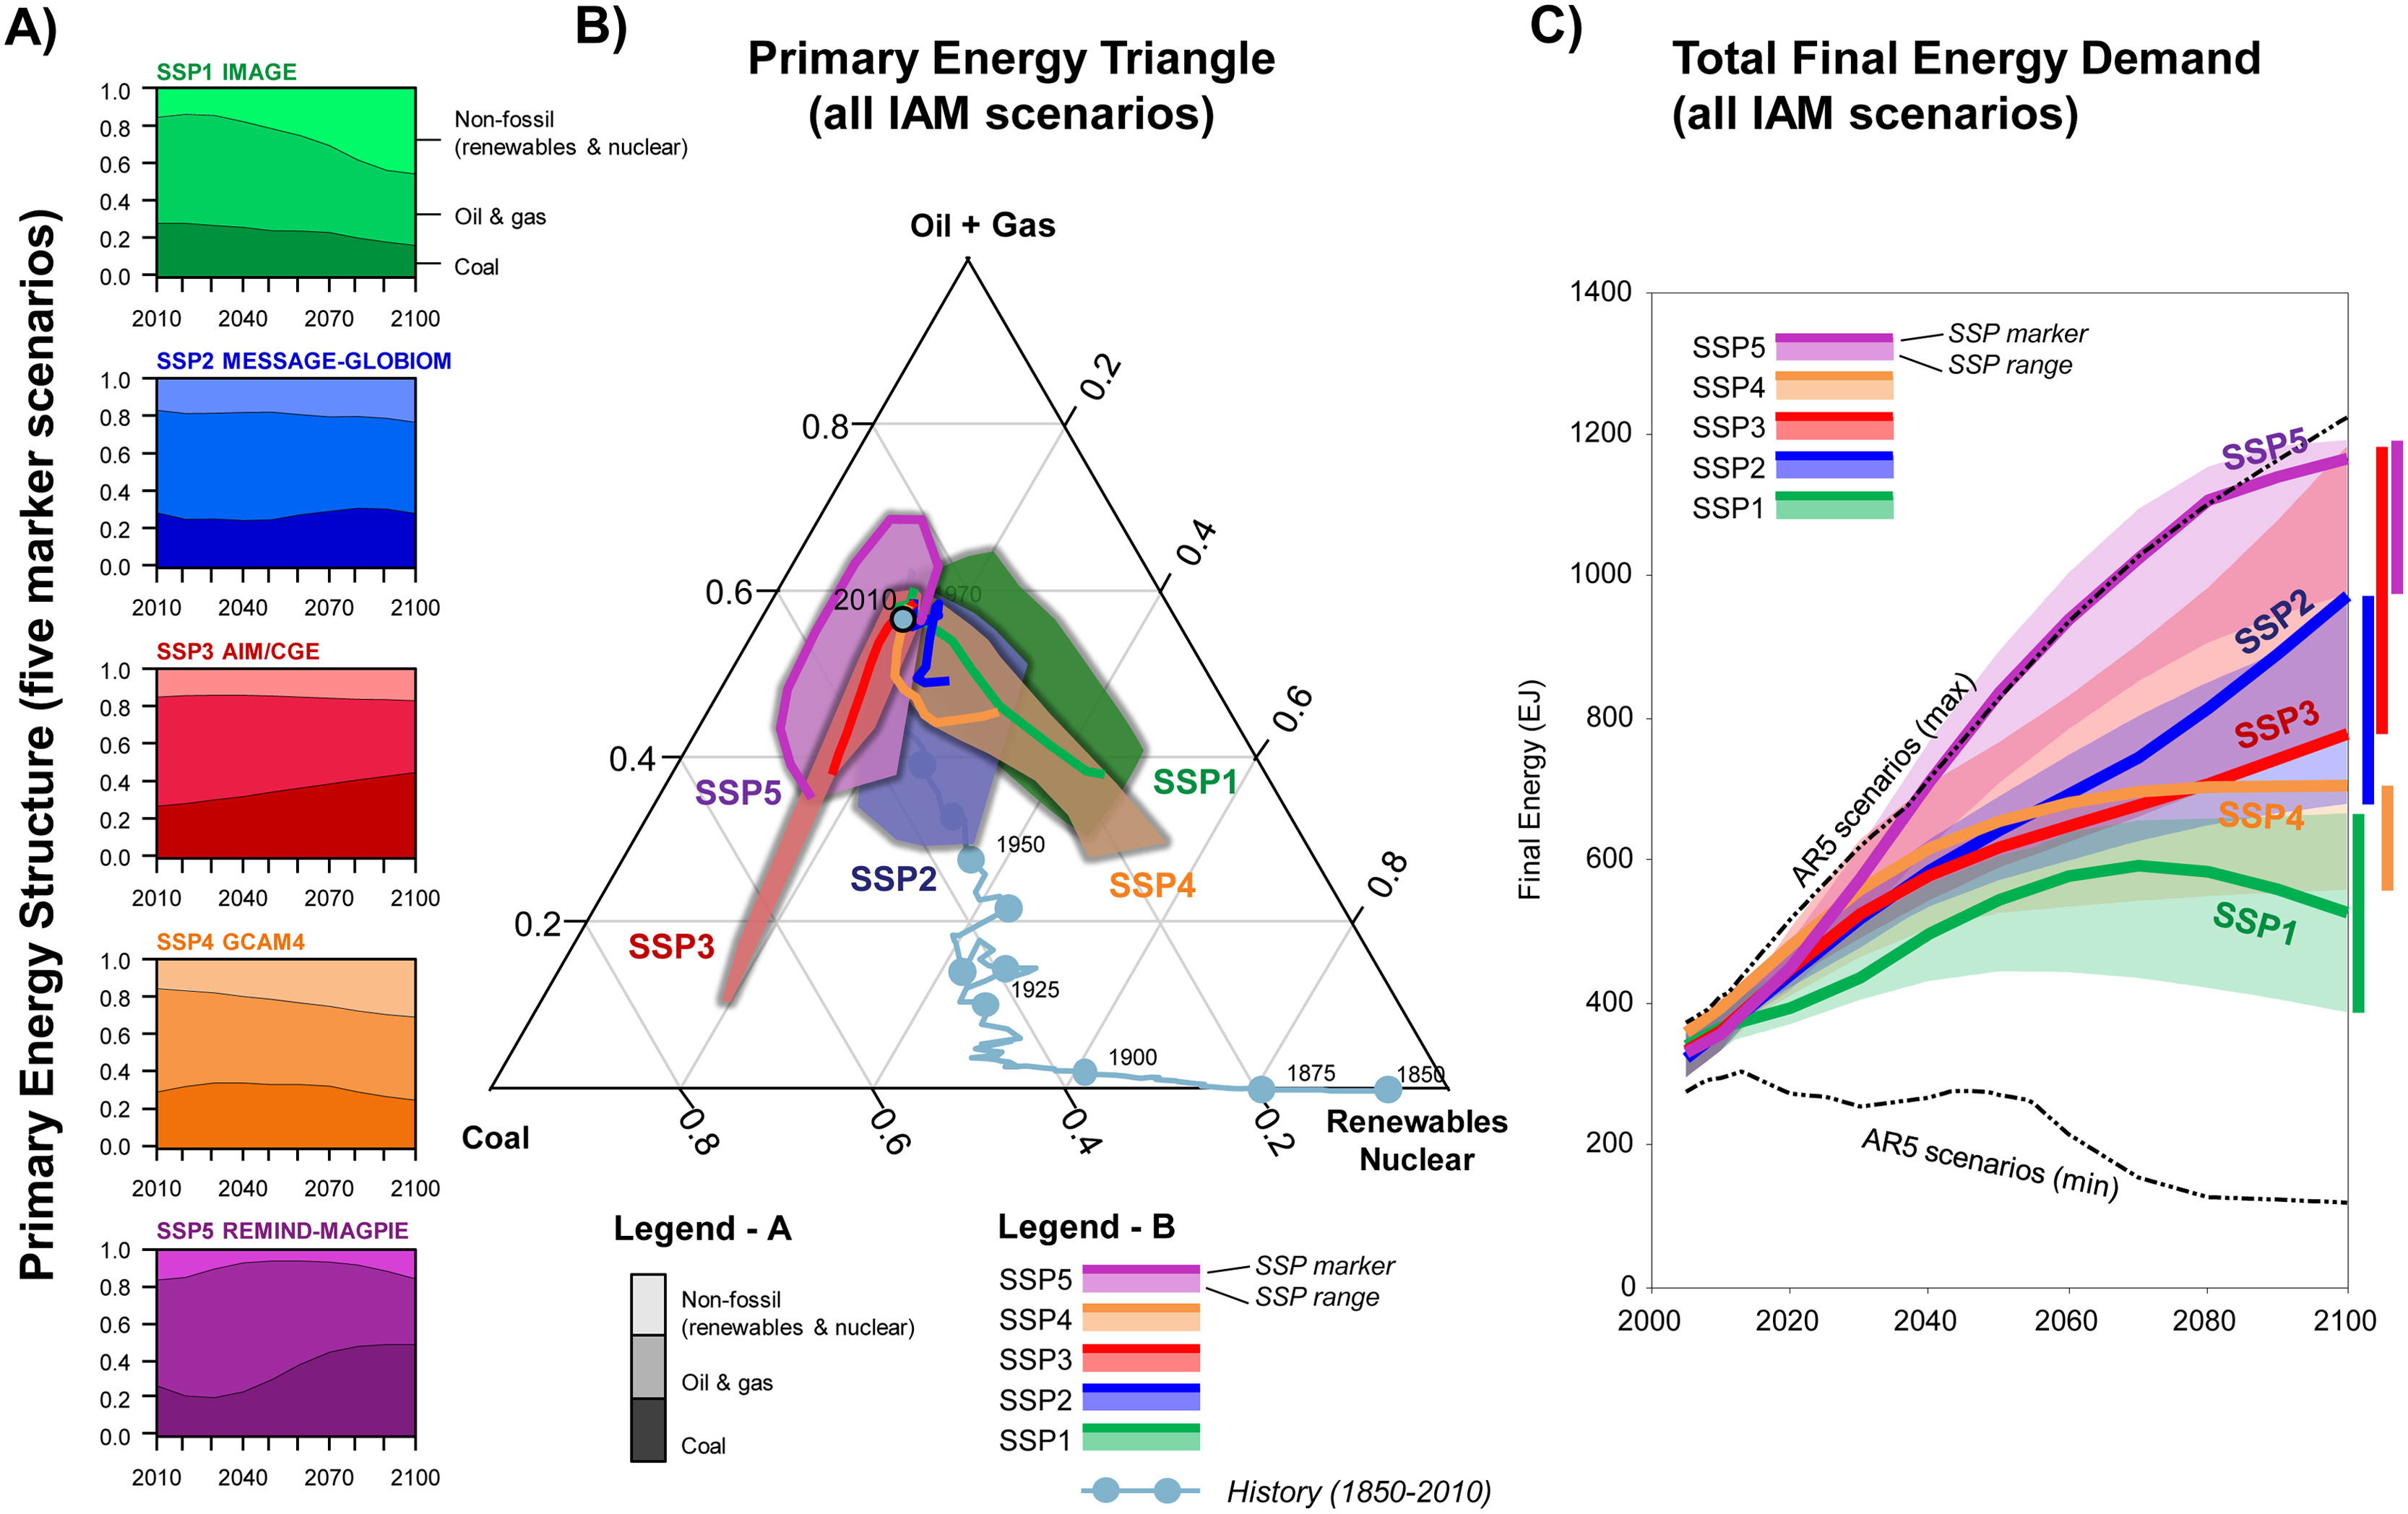
This paper and dataset presents the overview of the Shared Socioeconomic Pathways (SSPs) and their energy, land use, and emissions implications. The SSPs are part of a new scenario framework, established by the climate change research community in order to facilitate the integrated analysis of future climate impacts, vulnerabilities, adaptation, and mitigation. The pathways were developed over the last years as a joint community effort and describe plausible major global developments that together would lead in the future to different challenges for mitigation and adaptation to climate change. The SSPs are based on five narratives describing alternative socio-economic developments, including sustainable development, regional rivalry, inequality, fossil-fueled development, and middle-of-the-road development. The long-term demographic and economic projections of the SSPs depict a wide uncertainty range consistent with the scenario literature. A multi-model approach was used for the elaboration of the energy, land-use and the emissions trajectories of SSP-based scenarios. The baseline scenarios lead to global energy consumption of 400–1200 EJ in 2100, and feature vastly different land-use dynamics, ranging from a possible reduction in cropland area up to a massive expansion by more than 700 million hectares by 2100. The associated annual CO2 emissions of the baseline scenarios range from about 25 GtCO2 to more than 120 GtCO2 per year by 2100. With respect to mitigation, we find that associated costs strongly depend on three factors: (1) the policy assumptions, (2) the socio-economic narrative, and (3) the stringency of the target. The carbon price for reaching the target of 2.6 W/m2 that is consistent with a temperature change limit of 2 °C, differs in our analysis thus by about a factor of three across the SSP marker scenarios. Moreover, many models could not reach this target from the SSPs with high mitigation challenges. While the SSPs were designed to represent different mitigation and adaptation challenges, the resulting narratives and quantifications span a wide range of different futures broadly representative of the current literature. This allows their subsequent use and development in new assessments and research projects. Critical next steps for the community scenario process will, among others, involve regional and sectoral extensions, further elaboration of the adaptation and impacts dimension, as well as employing the SSP scenarios with the new generation of earth system models as part of the 6th climate model intercomparison project (CMIP6). Recommended article. The Shared Socioeconomic Pathways and their energy, land use, and greenhouse gas emissions implications: An overview, Global Environmental Change, Volume 42, Pages 153-168, 2017, ISSN 0959-3780, DOI:110.1016/j.gloenvcha.2016.05.009.
-
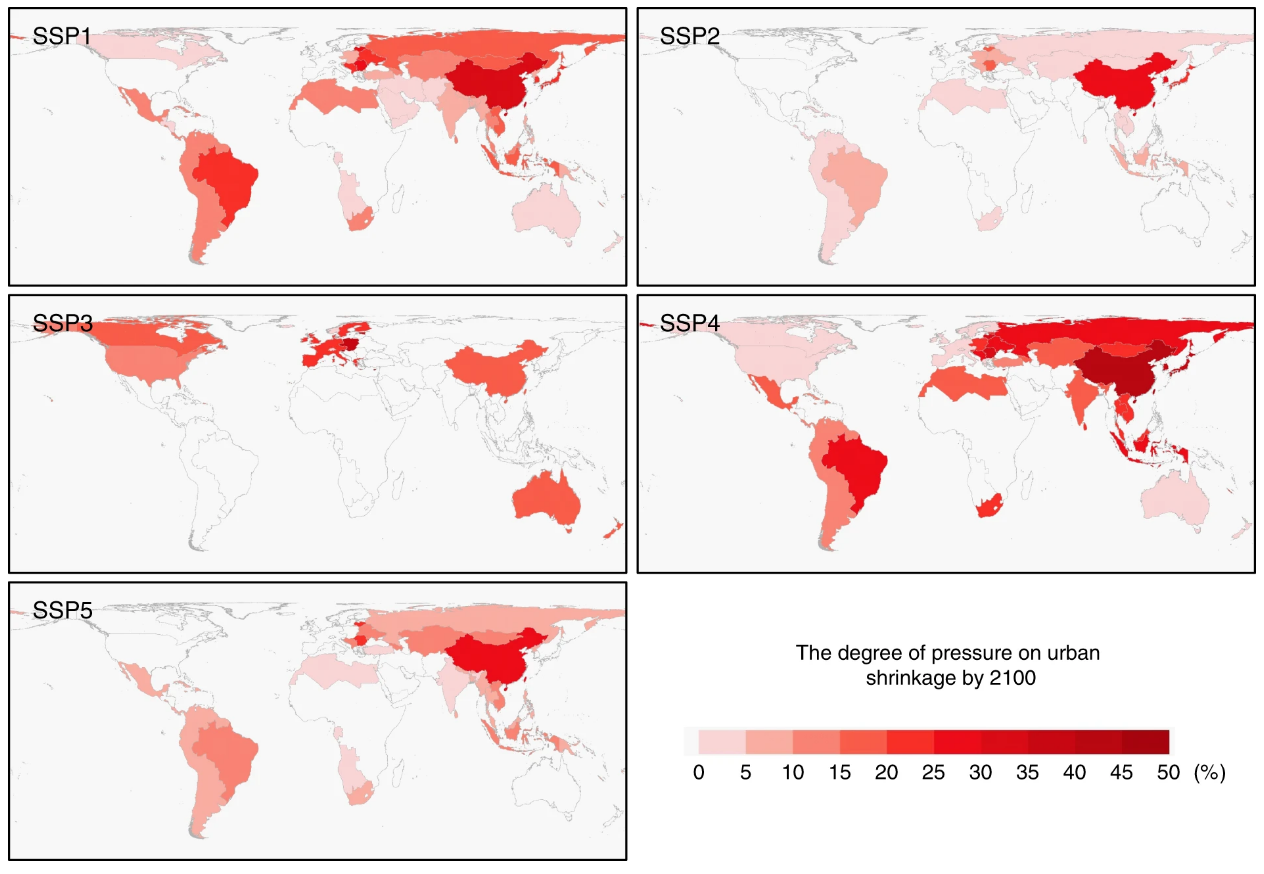
Dataset with article https://www.nature.com/articles/s41467-020-14386-x (https://doi.org/10.1038/s41467-020-14386-x). Despite its small land coverage, urban land and its expansion can have profound impacts on global environments. Therefore, a proper understanding of how future urban land change will affect other land covers is important to alleviate the social and environmental problems that challenge the sustainable developments of human societies. Recently, The Shared Socioeconomic Pathways (SSPs) were adopted by the Coupled Model Intercomparison Project Phase 6 (CMIP6), enabling researchers to conduct unified, comparable multi-scenario simulations and integrate such simulation products into climate change research. The SSPs focus on the key socio-economic factors including demographic dynamics, economic development, technological change, social, cultural, and institutional changes and policies. Here, we present the scenario projections of global urban land expansion under the framework of the shared socioeconomic pathways (SSPs) every 10 years from 2015 to 2100. Our projections feature a fine spatial resolution of 1 km that preserves spatial details and avoids potential distortions in urban land patterns. The objective is to enable the assessment of different scenarios of future urban expansion and their related impacts on a global scale under the latest recognized SSP scenarios.
-
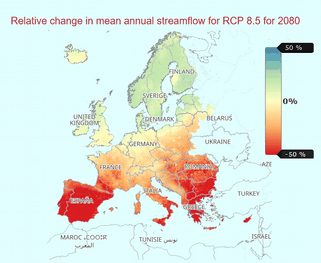
The dataset provides a number of indicators of the potential change, relative to a reference period of the recent past, in hydrological conditions over the 21st Century based on an ensemble of climate and hydrological models. The indicators cover hydrological variables of river discharge, soil moisture, snow water equivalent and groundwater recharge. These indicators are produced by various hydrological models using input variables of historical and projected precipitation, temperature and potential evapotranspiration. The indicators transform data from climate projections into usable information for the European water sector. They were defined in discussion with stakeholder groups working in different areas of the water sector (hydropower, irrigation, water supply) to provide clear information on climate projections for water resources as annual, seasonal and monthly change factors for a range of variables. A range of global climate models and standard projection scenarios (based on latest Copernicus Climate Change Service and Coupled Model Inter-comparison Project Phase 5 climate modelling experiments) were used along a multi-hydrological model approach to produce these indicators. This ensemble approach to the climate and hydrological modelling captures the uncertainty and variability of the hydrological regime. Precipitation and temperature data from five global climate models was downscaled to 5km x 5km resolution with the daily values disaggregated to 3-hourly values. These data were used to force four hydrological models to produce the hydrological variables to derive the indicators. The indicators are given as relative changes for a given 30-year projection window with respect to the reference period estimates of 1971-2010 for Representative Concentration Pathways (RCP) 2.6 and 8.5, for each grid cell. This dataset is produced on behalf of Copernicus Climate Change Service, by UK Centre for Ecology & Hydrology (UKCEH), Helmholtz Centre for Environmental Research (UFZ), Leipzig, Centro Tecnológico del Agua (Cetaqua), Climate Partnership LLC (CPL), Environment Agency (EA), Mediterranean Network of Basin Organisations (MENBO), Norwegian Water Resources & Energy Directorate (NVE).