 Stars4Water
Boundaries
Type of resources
Available actions
Topics
Keywords
Contact for the resource
Provided by
Years
Formats
Representation types
Update frequencies
status
Scale
Resolution
-
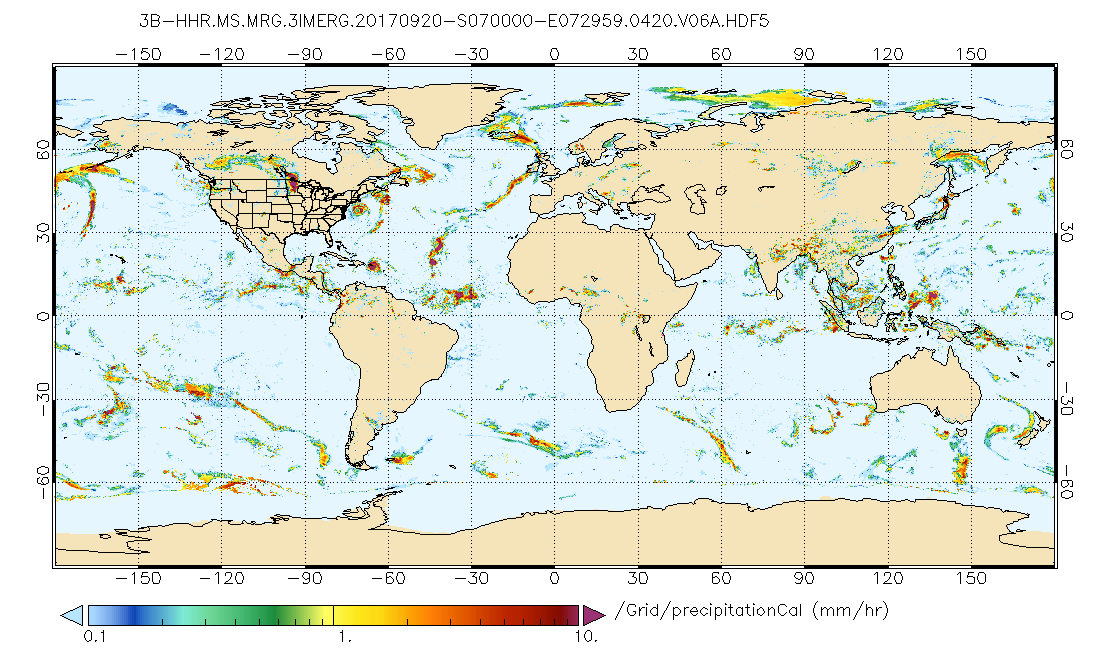
The Integrated Multi-satellitE Retrievals for GPM (IMERG) is the unified U.S. algorithm that provides the multi-satellite precipitation product for the U.S. GPM team. Minor Version 06B is the current version of the data set. Older versions will no longer be available and have been superseded by Version 06B. The precipitation estimates from the various precipitation-relevant satellite passive microwave (PMW) sensors comprising the GPM constellation are computed using the 2017 version of the Goddard Profiling Algorithm (GPROF2017), then gridded, intercalibrated to the GPM Combined Ku Radar-Radiometer Algorithm (CORRA) product, and merged into half-hourly 0.1°x0.1° (roughly 10x10 km) fields. Note that CORRA is adjusted to the monthly Global Precipitation Climatology Project (GPCP) Satellite-Gauge (SG) product over high-latitude ocean and tropical land to correct known biases. The half-hourly intercalibrated merged PMW estimates are then input to both the Climate Prediction Center (CPC) Morphing-Kalman Filter (CMORPH-KF) Lagrangian time interpolation scheme and the Precipitation Estimation from Remotely Sensed Information using Artificial Neural Networks Cloud Classification System (PERSIANN-CCS) re-calibration scheme. In parallel, CPC assembles the zenith-angle-corrected, intercalibrated merged geo-IR fields and forwards them to PPS for input to the PERSIANN-CCS algorithm (supported by an asynchronous re-calibration cycle) which are then input to the CMORPH-KF morphing (quasi-Lagrangian time interpolation) scheme. The CMORPH-KF morphing (supported by an asynchronous KF weights updating cycle) uses the PMW and IR estimates to create half-hourly estimates. The motion vectors for the morphing are computed by maximizing the pattern correlation of successive hours of the vertically integrated vapor (TQV) provided by the Modern-Era Retrospective Analysis for Research and Applications, Version 2 (MERRA-2) and Goddard Earth Observing System model Version 5 (GEOS-5) Forward Processing (FP) for the post-real-time (Final) Run and the near-real-time (Early and Late) Runs, respectively. The KF uses the morphed data as the “forecast” and the IR estimates as the “observations”, with weighting that depends on the time interval(s) away from the microwave overpass time. The IR becomes important after about ±90 minutes away from the overpass time. The IMERG system is run twice in near-real time: "Early" multi-satellite product ~4 hr after observation time using only forward morphing and "Late" multi-satellite product ~14 hr after observation time, using both forward and backward morphing and once after the monthly gauge analysis is received: "Final", satellite-gauge product ~3.5 months after the observation month, using both forward and backward morphing and including monthly gauge analyses. Currently, the near-real-time Early and Late half-hourly estimates have no concluding calibration, while in the post-real-time Final Run the multi-satellite half-hourly estimates are adjusted so that they sum to the Final Run monthly satellite-gauge combination. In all cases the output contains multiple fields that provide information on the input data, selected intermediate fields, and estimation quality. In general, the complete calibrated precipitation, precipitationCal, is the data field of choice for most users. Briefly describing the Final Run, the input precipitation estimates computed from the various satellite passive microwave sensors are intercalibrated to the CORRA product (because it is presumed to be the best snapshot TRMM/GPM estimate after adjustment to the monthly GPCP SG), then "forward/backward morphed" and combined with microwave precipitation-calibrated geo-IR fields, and adjusted with seasonal GPCP SG surface precipitation data to provide half-hourly and monthly precipitation estimates on a 0.1°x0.1° (roughly 10x10 km) grid over the globe. Precipitation phase is computed using analyses of surface temperature, humidity, and pressure. The current period of record is June 2000 to the present (delayed by about 3.5 months).
-

The Gridded Population of the World, Version 4 (GPWv4): Population Density, Revision 11 consists of estimates of human population density (number of persons per square kilometer) based on counts consistent with national censuses and population registers, for the years 2000, 2005, 2010, 2015, and 2020. A proportional allocation gridding algorithm, utilizing approximately 13.5 million national and sub-national administrative units, was used to assign population counts to 30 arc-second grid cells. The population density rasters were created by dividing the population count raster for a given target year by the land area raster. The data files were produced as global rasters at 30 arc-second (~1 km at the equator) resolution. To enable faster global processing, and in support of research communities, the 30 arc-second count data were aggregated to 2.5 arc-minute, 15 arc-minute, 30 arc-minute and 1 degree resolutions to produce density rasters at these resolutions.
-
The Food and Agriculture Organization of the United Nations (FAO) with the collaboration of the International Institute for Applied Systems Analysis (IIASA), has developed a system that enables rational land-use planning on the basis of an inventory of land resources and evaluation of biophysical limitations and potentials. This is referred to as the Agro-ecological Zones (AEZ) methodology.
-

The Gridded Population of the World, Version 4 (GPWv4): Population Density, Revision 11 consists of estimates of human population density (number of persons per square kilometer) based on counts consistent with national censuses and population registers, for the years 2000, 2005, 2010, 2015, and 2020. A proportional allocation gridding algorithm, utilizing approximately 13.5 million national and sub-national administrative units, was used to assign population counts to 30 arc-second grid cells. The population density rasters were created by dividing the population count raster for a given target year by the land area raster. The data files were produced as global rasters at 30 arc-second (~1 km at the equator) resolution. To enable faster global processing, and in support of research communities, the 30 arc-second count data were aggregated to 2.5 arc-minute, 15 arc-minute, 30 arc-minute and 1 degree resolutions to produce density rasters at these resolutions.
-
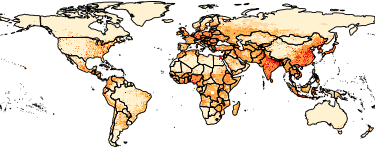

GlobWat uses spatially distributed input layers consisting of monthly precipitation, number of wet days per month, coefficient of variation of precipitation, monthly reference evapotranspiration, maximum soil moisture storage capacity, maximum percolation flux, irrigated areas, land use, and areas of open water and wetlands. All these input layers are based on freely available spatial dataset with a resolution of 10 arc minutes for the climate dataset and 5 arc minutes for all the terrain and land dataset (data sources are provided in the downloadable files). The water balance is calculated in two steps. First a vertical water balance is calculated that includes rainfall dependent evapotranspiration and evapotranspiration from crops under irrigated circumstances (for which it is assumed that it can be provided by surface water or groundwater). In a second stage, a horizontal water balance is calculated to correct for incremental evapotranspiration from open water and wetlands and to calculate discharges from river (sub-) basins taking into consideration the water needed for irrigation.
-
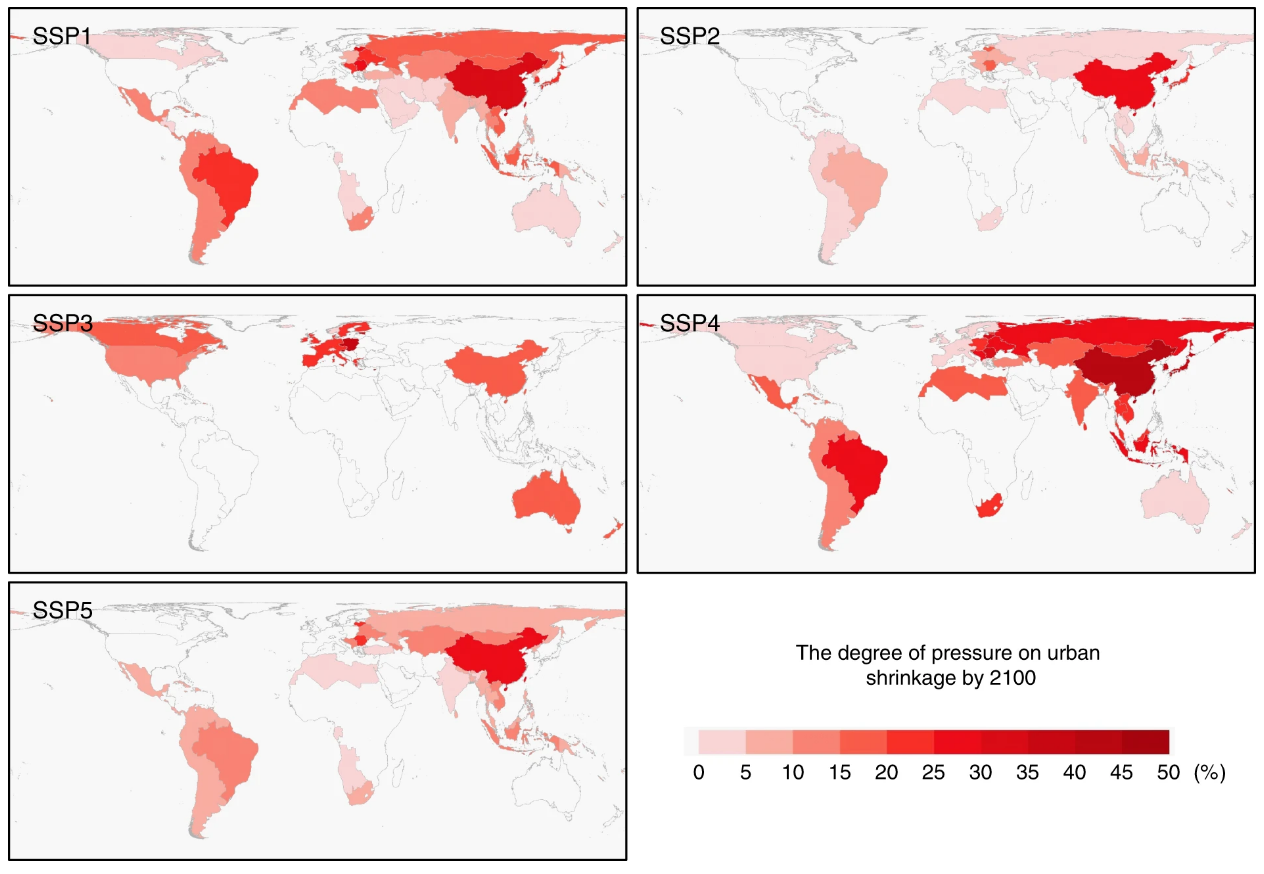
Dataset with article https://www.nature.com/articles/s41467-020-14386-x (https://doi.org/10.1038/s41467-020-14386-x). Despite its small land coverage, urban land and its expansion can have profound impacts on global environments. Therefore, a proper understanding of how future urban land change will affect other land covers is important to alleviate the social and environmental problems that challenge the sustainable developments of human societies. Recently, The Shared Socioeconomic Pathways (SSPs) were adopted by the Coupled Model Intercomparison Project Phase 6 (CMIP6), enabling researchers to conduct unified, comparable multi-scenario simulations and integrate such simulation products into climate change research. The SSPs focus on the key socio-economic factors including demographic dynamics, economic development, technological change, social, cultural, and institutional changes and policies. Here, we present the scenario projections of global urban land expansion under the framework of the shared socioeconomic pathways (SSPs) every 10 years from 2015 to 2100. Our projections feature a fine spatial resolution of 1 km that preserves spatial details and avoids potential distortions in urban land patterns. The objective is to enable the assessment of different scenarios of future urban expansion and their related impacts on a global scale under the latest recognized SSP scenarios.
-
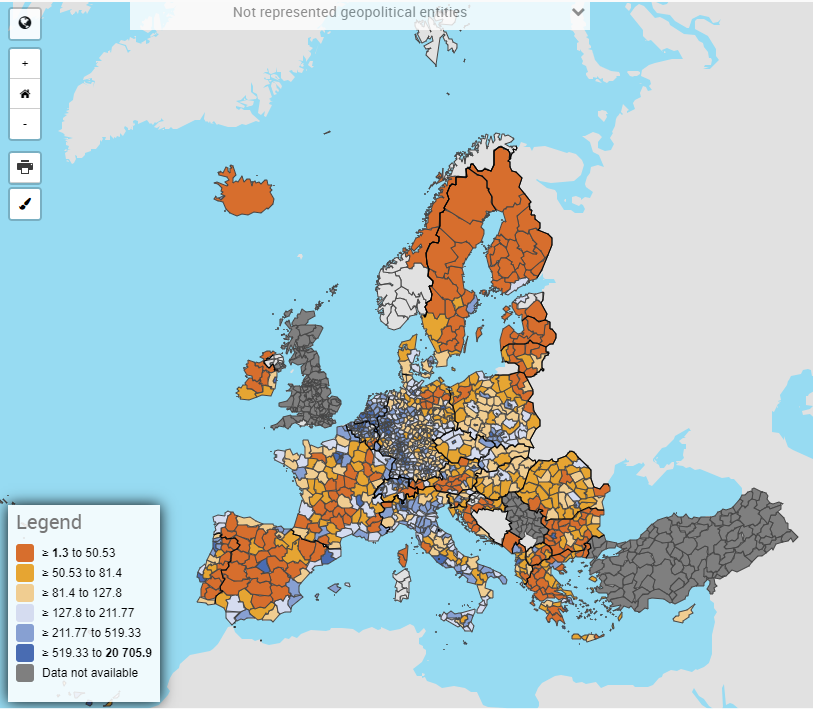
Member States send to Eurostat data on population on of 31 December of the reference year under Regulation 1260/2013 on European demographic statistics. The data are conventionally published by Eurostat as population on 1 January of the following year (reference year + 1). The aim is to collect annual mandatory and voluntary demographic data from the national statistical institutes. Mandatory data are those defined by the legislation listed under ‘6.1. Institutional mandate — legal acts and other agreements’. The completeness of the demographic data collected on a voluntary basis depends on the availability and completeness of information provided by the national statistical institutes. For more information on mandatory/voluntary data collection, see 6.1. Institutional mandate — legal acts and other agreements. The following statistics are available. Population on 1 January by sex and by: - single age and educational attainment / marital status / broad group of citizenship / broad group of country of birth; - five-year age group and citizenship / country of birth; - citizenship and broad group of country of birth / country of birth and broad group of citizenship; - broad age group and NUTS 3 (under regional data population folder); - single age and NUTS 2 (under regional data population folder); - five-year age group and NUTS 2 / NUTS 3 (under regional data population folder). Population structure statistics: median age of population, proportion of population by various age groups, old age dependency ratio.