 Stars4Water
boundaries
Type of resources
Available actions
Topics
Keywords
Contact for the resource
Provided by
Years
Formats
Representation types
Update frequencies
status
Scale
Resolution
-
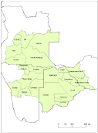
This layer represents the political regional boundaries (level of Province, Region and District) in the 4 riparian countries that share geographical overlapping with the Okavango Basin: Angola, Namibia, Botswana and Zimbabwe. Source: Digital Chart of the World (DCW) with further editing corrections for a more accurate spatial definition. This dataset is part of the GIS Database for the Environment Protection and Sustainable Management of the Okavango River Basin project (EPSMO). Detailed information on the GIS Database can be found in the “GIS Database for the EPSMO Project†document produced by Luis Veríssimo (FAO consultant) in July 2009, and here available for download.
-

This layer represents the political administration level 2 boundaries (level of Commune, and Constituency) in Angola and Namibia, that share geographical overlapping with the Okavango Basin. Source: Generated under the GIS EPSMO program. This dataset is part of the GIS Database for the Environment Protection and Sustainable Management of the Okavango River Basin project (EPSMO). Detailed information on the GIS Database can be found in the “GIS Database for the EPSMO Project†document produced by Luis Veríssimo (FAO consultant) in July 2009, and here available for download.
-
The Food and Agriculture Organization of the United Nations (FAO) with the collaboration of the International Institute for Applied Systems Analysis (IIASA), has developed a system that enables rational land-use planning on the basis of an inventory of land resources and evaluation of biophysical limitations and potentials. This is referred to as the Agro-ecological Zones (AEZ) methodology.
-
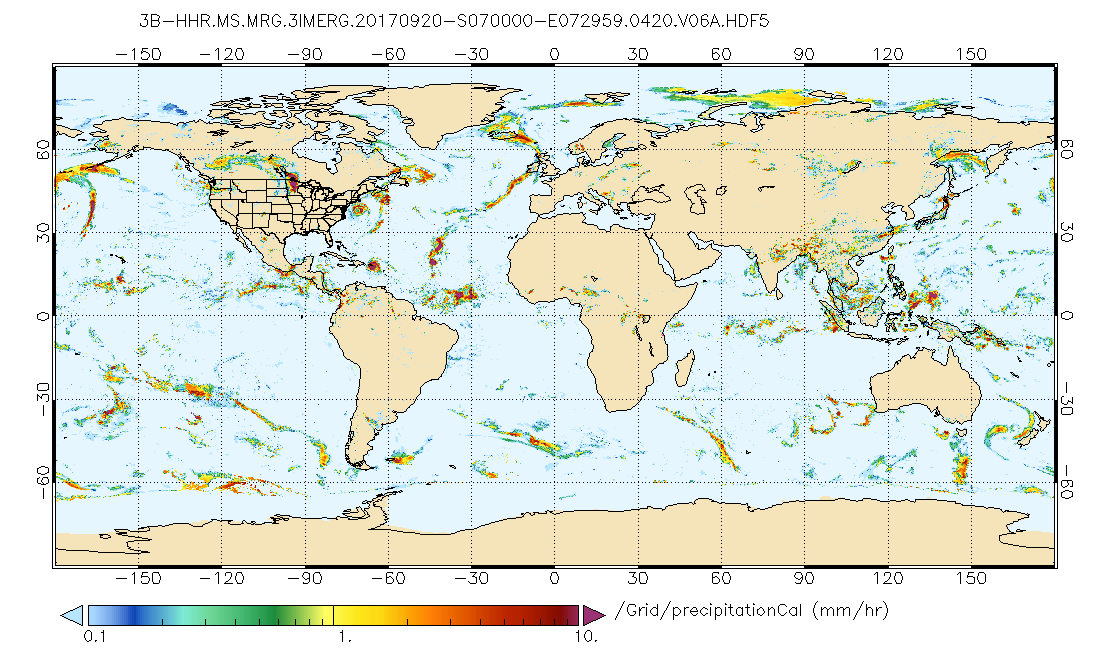
The Integrated Multi-satellitE Retrievals for GPM (IMERG) is the unified U.S. algorithm that provides the multi-satellite precipitation product for the U.S. GPM team. Minor Version 06B is the current version of the data set. Older versions will no longer be available and have been superseded by Version 06B. The precipitation estimates from the various precipitation-relevant satellite passive microwave (PMW) sensors comprising the GPM constellation are computed using the 2017 version of the Goddard Profiling Algorithm (GPROF2017), then gridded, intercalibrated to the GPM Combined Ku Radar-Radiometer Algorithm (CORRA) product, and merged into half-hourly 0.1°x0.1° (roughly 10x10 km) fields. Note that CORRA is adjusted to the monthly Global Precipitation Climatology Project (GPCP) Satellite-Gauge (SG) product over high-latitude ocean and tropical land to correct known biases. The half-hourly intercalibrated merged PMW estimates are then input to both the Climate Prediction Center (CPC) Morphing-Kalman Filter (CMORPH-KF) Lagrangian time interpolation scheme and the Precipitation Estimation from Remotely Sensed Information using Artificial Neural Networks Cloud Classification System (PERSIANN-CCS) re-calibration scheme. In parallel, CPC assembles the zenith-angle-corrected, intercalibrated merged geo-IR fields and forwards them to PPS for input to the PERSIANN-CCS algorithm (supported by an asynchronous re-calibration cycle) which are then input to the CMORPH-KF morphing (quasi-Lagrangian time interpolation) scheme. The CMORPH-KF morphing (supported by an asynchronous KF weights updating cycle) uses the PMW and IR estimates to create half-hourly estimates. The motion vectors for the morphing are computed by maximizing the pattern correlation of successive hours of the vertically integrated vapor (TQV) provided by the Modern-Era Retrospective Analysis for Research and Applications, Version 2 (MERRA-2) and Goddard Earth Observing System model Version 5 (GEOS-5) Forward Processing (FP) for the post-real-time (Final) Run and the near-real-time (Early and Late) Runs, respectively. The KF uses the morphed data as the “forecast” and the IR estimates as the “observations”, with weighting that depends on the time interval(s) away from the microwave overpass time. The IR becomes important after about ±90 minutes away from the overpass time. The IMERG system is run twice in near-real time: "Early" multi-satellite product ~4 hr after observation time using only forward morphing and "Late" multi-satellite product ~14 hr after observation time, using both forward and backward morphing and once after the monthly gauge analysis is received: "Final", satellite-gauge product ~3.5 months after the observation month, using both forward and backward morphing and including monthly gauge analyses. Currently, the near-real-time Early and Late half-hourly estimates have no concluding calibration, while in the post-real-time Final Run the multi-satellite half-hourly estimates are adjusted so that they sum to the Final Run monthly satellite-gauge combination. In all cases the output contains multiple fields that provide information on the input data, selected intermediate fields, and estimation quality. In general, the complete calibrated precipitation, precipitationCal, is the data field of choice for most users. Briefly describing the Final Run, the input precipitation estimates computed from the various satellite passive microwave sensors are intercalibrated to the CORRA product (because it is presumed to be the best snapshot TRMM/GPM estimate after adjustment to the monthly GPCP SG), then "forward/backward morphed" and combined with microwave precipitation-calibrated geo-IR fields, and adjusted with seasonal GPCP SG surface precipitation data to provide half-hourly and monthly precipitation estimates on a 0.1°x0.1° (roughly 10x10 km) grid over the globe. Precipitation phase is computed using analyses of surface temperature, humidity, and pressure. The current period of record is June 2000 to the present (delayed by about 3.5 months).
-
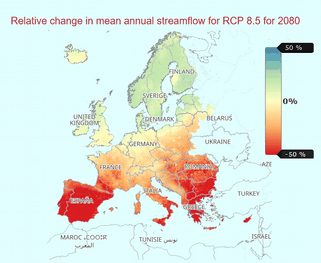
The dataset provides a number of indicators of the potential change, relative to a reference period of the recent past, in hydrological conditions over the 21st Century based on an ensemble of climate and hydrological models. The indicators cover hydrological variables of river discharge, soil moisture, snow water equivalent and groundwater recharge. These indicators are produced by various hydrological models using input variables of historical and projected precipitation, temperature and potential evapotranspiration. The indicators transform data from climate projections into usable information for the European water sector. They were defined in discussion with stakeholder groups working in different areas of the water sector (hydropower, irrigation, water supply) to provide clear information on climate projections for water resources as annual, seasonal and monthly change factors for a range of variables. A range of global climate models and standard projection scenarios (based on latest Copernicus Climate Change Service and Coupled Model Inter-comparison Project Phase 5 climate modelling experiments) were used along a multi-hydrological model approach to produce these indicators. This ensemble approach to the climate and hydrological modelling captures the uncertainty and variability of the hydrological regime. Precipitation and temperature data from five global climate models was downscaled to 5km x 5km resolution with the daily values disaggregated to 3-hourly values. These data were used to force four hydrological models to produce the hydrological variables to derive the indicators. The indicators are given as relative changes for a given 30-year projection window with respect to the reference period estimates of 1971-2010 for Representative Concentration Pathways (RCP) 2.6 and 8.5, for each grid cell. This dataset is produced on behalf of Copernicus Climate Change Service, by UK Centre for Ecology & Hydrology (UKCEH), Helmholtz Centre for Environmental Research (UFZ), Leipzig, Centro Tecnológico del Agua (Cetaqua), Climate Partnership LLC (CPL), Environment Agency (EA), Mediterranean Network of Basin Organisations (MENBO), Norwegian Water Resources & Energy Directorate (NVE).
-

GlobWat uses spatially distributed input layers consisting of monthly precipitation, number of wet days per month, coefficient of variation of precipitation, monthly reference evapotranspiration, maximum soil moisture storage capacity, maximum percolation flux, irrigated areas, land use, and areas of open water and wetlands. All these input layers are based on freely available spatial dataset with a resolution of 10 arc minutes for the climate dataset and 5 arc minutes for all the terrain and land dataset (data sources are provided in the downloadable files). The water balance is calculated in two steps. First a vertical water balance is calculated that includes rainfall dependent evapotranspiration and evapotranspiration from crops under irrigated circumstances (for which it is assumed that it can be provided by surface water or groundwater). In a second stage, a horizontal water balance is calculated to correct for incremental evapotranspiration from open water and wetlands and to calculate discharges from river (sub-) basins taking into consideration the water needed for irrigation.
-

This layer represents the political administration level 1 boundaries (level of municipality, (Region) and subdistrict) in the 4 riparian countries, that share geographical overlapping with the Okavango Basin: Angola, Namibia, Botswana and Zimbabwe. Source: Generated under the GIS EPSMO program. This dataset is part of the GIS Database for the Environment Protection and Sustainable Management of the Okavango River Basin project (EPSMO). Detailed information on the GIS Database can be found in the “GIS Database for the EPSMO Project†document produced by Luis Veríssimo (FAO consultant) in July 2009, and here available for download.
-

Grids with monthly values of coefficient of variation of precipitation for the period 1961-1990, at 5 arc min. Based on: New, M., Lister, D., Hulme, M. and Makin, I., 2002: A high-resolution data set of surface climate over global land areas. Climate Research 21:1-25
-
This map builds upon work done by Dixon (Dixon et al., 2001) in an attempt to propose a general classification of major farming systems. Based on a combination of global dataset, the map proposes a harmonized classification of major agricultural systems used as the basis for the analysis of SOLAW's Systems at risk. The map is based on an interpretation of global land cover data, combined with thematic datasets showing irrigated land and paddy rice extent. The map is published in SOLAW Report: The state of the world's land and water resources for food and agriculture - Managing systems at risk (2011) and SOLAW Thematic Report 15: Sustainable options for addressing land and water problems - a problem tree and case studies (links in the online resources section).
-
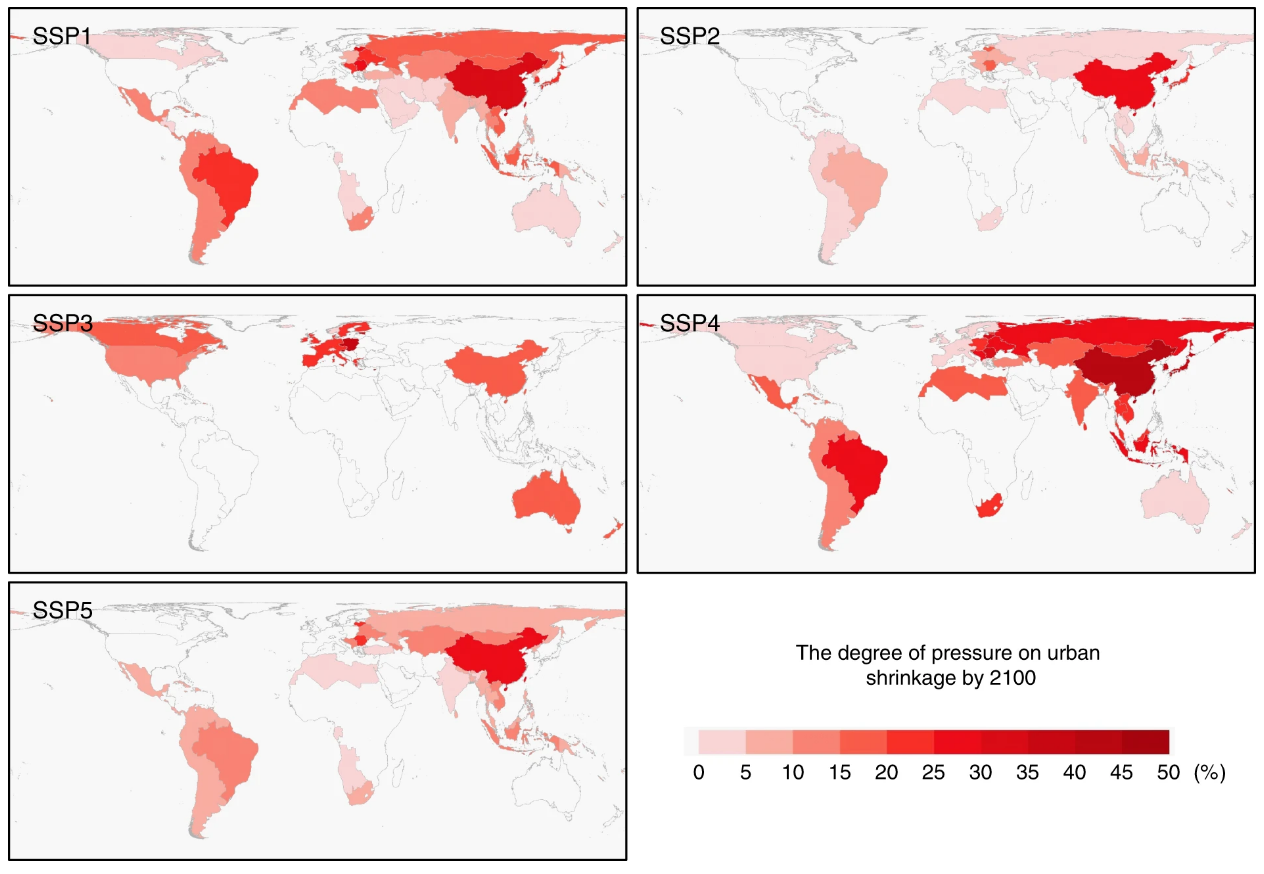
Dataset with article https://www.nature.com/articles/s41467-020-14386-x (https://doi.org/10.1038/s41467-020-14386-x). Despite its small land coverage, urban land and its expansion can have profound impacts on global environments. Therefore, a proper understanding of how future urban land change will affect other land covers is important to alleviate the social and environmental problems that challenge the sustainable developments of human societies. Recently, The Shared Socioeconomic Pathways (SSPs) were adopted by the Coupled Model Intercomparison Project Phase 6 (CMIP6), enabling researchers to conduct unified, comparable multi-scenario simulations and integrate such simulation products into climate change research. The SSPs focus on the key socio-economic factors including demographic dynamics, economic development, technological change, social, cultural, and institutional changes and policies. Here, we present the scenario projections of global urban land expansion under the framework of the shared socioeconomic pathways (SSPs) every 10 years from 2015 to 2100. Our projections feature a fine spatial resolution of 1 km that preserves spatial details and avoids potential distortions in urban land patterns. The objective is to enable the assessment of different scenarios of future urban expansion and their related impacts on a global scale under the latest recognized SSP scenarios.