 Stars4Water
2020
Type of resources
Available actions
Topics
Keywords
Contact for the resource
Provided by
Years
Formats
Representation types
Update frequencies
status
Scale
Resolution
-
This dataset is one derivative product from GAEZ v4 for year 2015 that includes gridded (5-arcminute resolution) irrigated and rainfed crop harvested area and crop yield for 26 different crops/crop categories (please see GAEZ_2015_Dimension_crops.csv for the full list). For each country, the production for each crop was extracted from the FAOSTAT database (http://www.fao.org/faostat/en/#data/QC; data downloaded April 2020). The three years average (2009-2011) of annual national crop production data was considered to represent 2010 national crop production, and the three years average (2014-2016) of annual crop production data to represent 2015 national crop production. The method for updating crop production from 2010 to 2015 was the same as described for crop harvested area, except using the 2010 national crop areas, A_(P_(m,2010))^k and the crop production ratio FP,m,i. Unit of measure Crop Production: 1000 tonnes (10e6 kg) per 5-arcminute grid cell More information about this global gridded crop harvest area, crop production, and crop yield and selected crops dataset is available in the full metadata at https://data.apps.fao.org/map/catalog/srv/eng/catalog.search#/metadata/74bab234-3a1e-442d-93cf-0b34859e9a60
-
GlobTemperature is an ESA project that provides access to multipurpose satellite-based land, lake and ice surface temperature data sets. Historical period and resolutions vary.
-
The Global Runoff Data Base (GRDB) comprises river discharge data of well over 10,000 gauging stations from all over the world.
-
Estimates of population density with age/sex breakdowns for each 100m x 100m grid square on the planet.
-
This dataset is one derivative product from GAEZ v4 for year 2015 that includes gridded (5-arcminute resolution) irrigated and rainfed crop harvested area and crop production for 26 different crops/crop categories (please see GAEZ_2015_Dimension_crops.csv for the full list). FAOSTAT yield data for all countries and crops does not directly reported yield values for the years 2009-2010 and 2014-2016. Hence, yield values were calculated from production and area, (http://www.fao.org/faostat/en/#data/QA). For this dataset, the 2015 crop yield grids were computed by doing a grid cell by grid cell division of crop production by crop harvested area, for all crops, both irrigated and rainfed. For each crop, m, and grid cell, k, crop yield in 2015 was computed as the ratio of crop production in 2015 to crop harvested area in 2015. Note: For many grid cells and many crops, the harvested area in this dataset is zero and the yield value is reported as -3.39999999999999996e+38. Unit of measure Crop Yield: tonnes per ha (1000 kg ha-1; 0.1 kg m-2) More information about this global gridded crop harvest area, crop production, and crop yield and selected crops dataset is available in the full metadata at https://data.apps.fao.org/map/catalog/srv/eng/catalog.search#/metadata/74bab234-3a1e-442d-93cf-0b34859e9a60
-
River network and a drainage model with catchments and drainage lines for Europe (derived from EU-DEM).
-
The global map of transboundary aquifers (TBAs) shows the surface delineation of aquifers extending over country borders.
-
This dataset is one derivative product from GAEZ v4 for year 2015 that includes gridded (5-arcminute resolution) irrigated and rainfed crop production and crop yield for 26 different crops/crop categories (please see GAEZ_2015_Dimenision_crops.csv for the full list). For each country, the harvested area for each crop was extracted from the FAOSTAT database (http://www.fao.org/faostat/en/#data/QC; data downloaded April 2020). The three years average (2009-2011) of annual national crop harvested area data was considered to represent 2010 national crop harvest area, and the three years average (2014-2016) of annual crop harvested area data to represent 2015 national crop harvest area. The GAEZ v4.0 global gridded (5-arcminute) 2010 crop harvest area product (Fischer et al., 2021) was used as base layer for generating the updated crop harvested area for year 2015. For each grid cell, the crop harvested area in the 2010 product was multiplied by the fractional change from 2010 to 2015 in harvested area for that crop and country. In cases where a grid cell shares its area between multiple countries, the country area-fraction weighted-average was used for the calculation of the given crop. Note, a cell table of country fractions in the given cell (f_(m,i)^k) was based on the Global Administrative Unit Layers (GAUL) of FAO (http://www.fao.org/geonetwork/srv/en/metadata.show?id=12691). Unit of measure Crop harvested area: 1000 ha (10e7 m2) per 5-arcminute grid cell More information about this global gridded crop harvest area, crop production, and crop yield and selected crops dataset is available in the full metadata at https://data.apps.fao.org/map/catalog/srv/eng/catalog.search#/metadata/74bab234-3a1e-442d-93cf-0b34859e9a60
-
This dataset, GAEZ+_2015, provides global, gridded (5-arcminute resolution) irrigated and rainfed crop harvested areas, irrigated and rainfed crop production, and irrigated and rainfed crop yield for 26 different crops/crop categories (please see GAEZ_2015 crops.csv for the full list). This new product is an update to 2015 of the Global Agro-Ecological Zones (GAEZ) Version 4 data of c.2010 crop harvested area (Fischer et al. 2012; note GAEZ v4.0 is not published, this citation is to v3.0). This product is based on national statistics and ignores changes in the spatial distribution of cropland. It was developed as an intermediate product for studies that rely on GAEZ data, providing more recent data on production, yield, and harvested areas. It is not meant to depict the spatial distribution of crops at the pixel level in 2015 accurately, and will become obsolete as soon as a more formal update of GAEZ becomes available that updates pixel level data using the GAEZ methodology. This new product updates the 2010 GAEZ crop harvest area, crop production, and crop yield maps (Fischer et al., 2012), using national-scale data on the fractional change in crop harvested area and production from 2010 to 2015, based on statistics for 160 crops from FAOSTAT (http://www.fao.org/faostat/en/#data/QA). More information on the methodology is available in the Data Quality sections of this metadata.
-
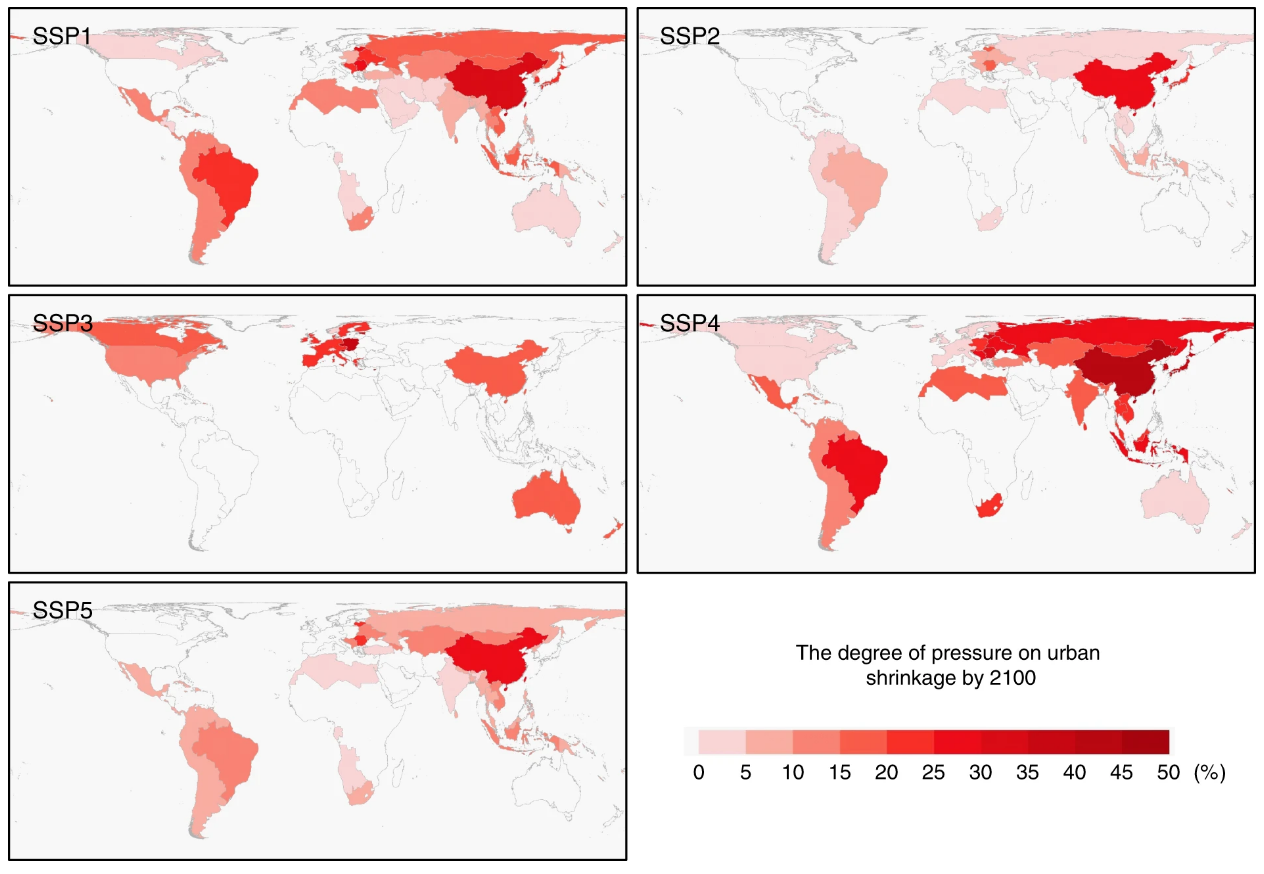
Dataset with article https://www.nature.com/articles/s41467-020-14386-x (https://doi.org/10.1038/s41467-020-14386-x). Despite its small land coverage, urban land and its expansion can have profound impacts on global environments. Therefore, a proper understanding of how future urban land change will affect other land covers is important to alleviate the social and environmental problems that challenge the sustainable developments of human societies. Recently, The Shared Socioeconomic Pathways (SSPs) were adopted by the Coupled Model Intercomparison Project Phase 6 (CMIP6), enabling researchers to conduct unified, comparable multi-scenario simulations and integrate such simulation products into climate change research. The SSPs focus on the key socio-economic factors including demographic dynamics, economic development, technological change, social, cultural, and institutional changes and policies. Here, we present the scenario projections of global urban land expansion under the framework of the shared socioeconomic pathways (SSPs) every 10 years from 2015 to 2100. Our projections feature a fine spatial resolution of 1 km that preserves spatial details and avoids potential distortions in urban land patterns. The objective is to enable the assessment of different scenarios of future urban expansion and their related impacts on a global scale under the latest recognized SSP scenarios.