 Stars4Water
land use
Type of resources
Available actions
Topics
Keywords
Contact for the resource
Provided by
Years
Formats
Representation types
Update frequencies
status
Scale
Resolution
-

The FGGD irrigated areas map is a global raster datalayer with a resolution of 5 arc-minutes. Each pixel in the map contains a value representing the percentage of the area equipped for irrigation. The data are a IIASA modification of FAO and University of Kessel (2002), Digital Global Map of Irrigated Areas v. 2.1. Please for the latest version refer to www.fao.org/ag/agl/aglw/aquastat/irrigationmap/index10.stm
-

The Food and Agriculture Organization of the United Nations (FAO) with the collaboration of the International Institute for Applied Systems Analysis (IIASA), has developed a system that enables rational land-use planning on the basis of an inventory of land resources and evaluation of biophysical limitations and potentials. This is referred to as the Agro-ecological Zones (AEZ) methodology.
-
This map builds upon work done by Dixon (Dixon et al., 2001) in an attempt to propose a general classification of major farming systems. Based on a combination of global dataset, the map proposes a harmonized classification of major agricultural systems used as the basis for the analysis of SOLAW's Systems at risk. The map is based on an interpretation of global land cover data, combined with thematic datasets showing irrigated land and paddy rice extent. The map is published in SOLAW Report: The state of the world's land and water resources for food and agriculture - Managing systems at risk (2011) and SOLAW Thematic Report 15: Sustainable options for addressing land and water problems - a problem tree and case studies (links in the online resources section).
-
The map shows the total annual water withdrawal. Water withdrawals are downscaled to to a five arc-minute grid. Water is considered scarce when the withdrawals exceed 40% of the renewable resource. According to statistics compiled by FAO (FAOSTAT), several countries in North Africa, the Middle East and Central Asia withdraw more water than their total renewable resources. Domestic water withdrawals are downscaled by applying the per capita domestic water use to population of each pixel. Industrial water withdrawals were downscaled by using the industrial water use per unit GDP and applying downscaled information on GDP. Water consumption is assumed to be 30% of domestic use and 10% of industrial use. Finally, agricultural water consumption is assumed to be the crop water deficit in irrigated areas generated in the AEZ analysis and water used for livestock consumption, applied to a global spatial data set of livestock distribution prepared by FAO. Source of the map: GAEZ 2009 and AQUASTAT; downscaling simulations by authors.
-
Delineation of Communal Conservancies in Namibia, that share geographical overlapping with the Okavango Basin. Source: Ministry of Agriculture, Water and Forestry of Namibia. This dataset is part of the GIS Database for the Environment Protection and Sustainable Management of the Okavango River Basin project (EPSMO). Detailed information on the database can be found in the “GIS Database for the EPSMO Project†document produced by Luis Veríssimo (FAO consultant) in July 2009, and here available for download.
-

The map summarizes the status of the land use and land cover at global scale. It was compiled according to the current GAEZ (Global Agro-Ecological Zones) -2009 approach, developed by FAO in collaboration with IIASA (International Institute for Applied Systems Analysis).The current Global AEZ (GAEZ-2009) offers a standardized framework for the characterization of climate, soil and terrain conditions relevant to agricultural production, which can be applied at global to sub-national levels. The map is based on six geographic datasets: - GLC2000 land cover database at 30 arc-sec (http://www-gvm.jrc.it/glc2000), using regional and global legends (JRC, 2006); - an IFPRI global land cover categorization providing 17 land cover classes at 30 arc-sec. (IFPRI, 2002), based on a reinterpretation of the Global Land Cover Characteristics Database (GLCC ver. 2.0), EROS Data Centre (EDC, 2000); - FAO’s Global Forest Resources Assessment 2000 and 2005 (FAO, 2001; FAO, 2006) at 30 arc-sec. resolution; - digital Global Map of Irrigated Areas (GMIA) version 4.0 of (FAO/University of Frankfurt) at 5’ by 5’ latitude/longitude resolution, providing by grid-cell the percentage land area equipped with irrigation infrastructure (Siebert et al., 2007); - a spatial population density inventory (30-arc seconds) for year 2000 developed by FAO-SDRN, based on spatial data of LANDSCAN 2003, with calibration to UN 2000 population figures. An iterative calculation procedure has been implemented to estimate land cover class weights, consistent with aggregate FAO land statistics and spatial land cover patterns obtained from remotely sensed data, allowing the quantification of major land use/land cover shares in individual 5’ by 5’ latitude/longitude grid cells.
-
The map shows the ratio of total withdrawals to the available renewable water resource. Renewable water resources are downscaled to a five arc-minute grid. Water is considered scarce when the withdrawals exceed 40% of the renewable resource. According to statistics compiled by FAO (FAOSTAT),several countries in North Africa, the Middle East and Central Asia withdraw more water than their total renewable resources. Domestic water withdrawals are downscaled by applying the per capita domestic water use to population of each pixel. Industrial water withdrawals were downscaled by using the industrial water use per unit GDP and applying downscaled information on GDP. Water consumption is assumed to be 30% of domestic use and 10% of industrial use. Finally, agricultural water consumption is assumed to be the crop water deficit in irrigated areas generated in the AEZ analysis and water used for livestock consumption, applied to a global spatial data set of livestock distribution prepared by FAO.Source of the map: GAEZ 2009 and AQUASTAT; downscaling simulations by authors.
-

Farms plots, as of 2005, in Namibia, that share geographical overlapping with the Okavango Basin. Source: Ministry of Agriculture, Water and Forestry of Namibia. This dataset is part of the GIS Database for the Environment Protection and Sustainable Management of the Okavango River Basin project (EPSMO). Detailed information on the database can be found in the “GIS Database for the EPSMO Project†document produced by Luis Veríssimo (FAO consultant) in July 2009, and here available for download.
-

Town lands in Namibia, that share geographical overlapping with the Okavango Basin. Source: Ministry of Agriculture, Water and Forestry of Namibia. This dataset is part of the GIS Database for the Environment Protection and Sustainable Management of the Okavango River Basin project (EPSMO). Detailed information on the database can be found in the “GIS Database for the EPSMO Project†document produced by Luis Veríssimo (FAO consultant) in July 2009, and here available for download.
-
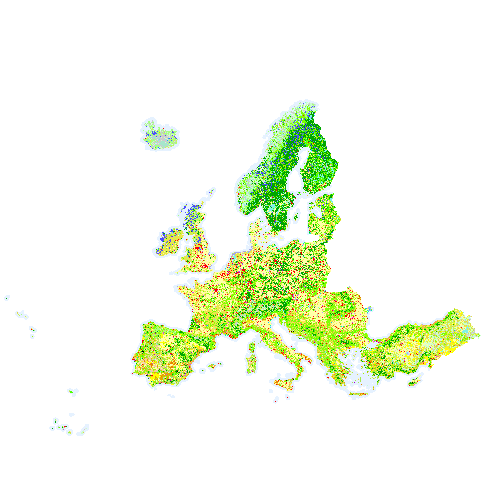
Corine Land Cover 2018 (CLC2018) is one of the Corine Land Cover (CLC) datasets produced within the frame the Copernicus Land Monitoring Service referring to land cover / land use status of year 2018. CLC service has a long-time heritage (formerly known as "CORINE Land Cover Programme"), coordinated by the European Environment Agency (EEA). It provides consistent and thematically detailed information on land cover and land cover changes across Europe. CLC datasets are based on the classification of satellite images produced by the national teams of the participating countries - the EEA members and cooperating countries (EEA39). National CLC inventories are then further integrated into a seamless land cover map of Europe. The resulting European database relies on standard methodology and nomenclature with following base parameters: 44 classes in the hierarchical 3-level CLC nomenclature; minimum mapping unit (MMU) for status layers is 25 hectares; minimum width of linear elements is 100 metres. Change layers have higher resolution, i.e. minimum mapping unit (MMU) is 5 hectares for Land Cover Changes (LCC), and the minimum width of linear elements is 100 metres. The CLC service delivers important data sets supporting the implementation of key priority areas of the Environment Action Programmes of the European Union as e.g. protecting ecosystems, halting the loss of biological diversity, tracking the impacts of climate change, monitoring urban land take, assessing developments in agriculture or dealing with water resources directives. CLC belongs to the Pan-European component of the Copernicus Land Monitoring Service (https://land.copernicus.eu/), part of the European Copernicus Programme coordinated by the European Environment Agency, providing environmental information from a combination of air- and space-based observation systems and in-situ monitoring. Additional information about CLC product description including mapping guides can be found at https://land.copernicus.eu/user-corner/technical-library/. CLC class descriptions can be found at https://land.copernicus.eu/user-corner/technical-library/corine-land-cover-nomenclature-guidelines/html/.