 Stars4Water
TIFF
Type of resources
Available actions
Topics
Keywords
Contact for the resource
Provided by
Years
Formats
Representation types
Update frequencies
status
Resolution
-
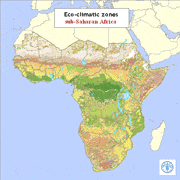
Eco-climatic zones were produced taking into account land-surface and atmospheric characteristics (the photosynthetic activity, the temperature of the earth?s surface, the atmospheric drying power, the rainfall, the potential evapotranspiration, the length of growing period for plants, the surface elevation). Most of these features could be accurately predicted using satellite data; some others needed a combination of remotely sensed and ground-based data. Remotely sensed data were acquired by NOAA-AVHRR sensor and by Meteosat satellite. The AVHRR satellite data were available in dekadal images for a 13 year series from 1982-1994. Meteosat imagery runs from 1988 to 1997. The information layer was produced for FAO in January 1999 by Environmental Research Group Oxford (ERGO Ltd) in collaboration with the Trypanosomosis and Land Use in Africa (TALA) research group at the Department of Zoology, University of Oxford.
-
The FGGD CV of LGP map is a global raster datalayer with a resolution of 5 arc-minutes. Each pixel contains an average coefficient of variation of LGP for the pixel area over the period 1901-1966. The data are from FAO and IIASA, 2000, Global agro-ecological zones, as reported in FAO and IIASA, 2007, Mapping biophysical factors that influence agricultural production and rural vulnerability, by H. von Velthuizen et al.
-

The FGGD terrain slope constraints map is a global raster datalayer with a resolution of 5 arc-minutes. Each pixel contains a class value for the degree to which terrain slope constrains agricultural production potential in the pixel area. The data are from FAO and IIASA, 2000, Global agro-ecological zones, as reported in FAO and IIASA, 2007, Mapping biophysical factors that influence agricultural production and rural vulnerability, by H. von Velthuizen et al.
-

Reference evapotranspiration per dekade with a spatial resolution of 0.1 degree. Unit: mm dekad-1. The dataset contains dekadal values for global land areas, excluding Antarctica, since 1979. The dataset has been prepared according to the FAO Penman - Monteith method as described in FAO Irrigation and Drainage Paper 56. The input variables are part of the Agrometeorological indicators dataset produced by the European Centre for Medium-Range Weather Forecasts (ECMWF) through the Copernicus Climate Change Service (C3S). The Agrometeorological indicators dataset provides daily surface meteorological data for the period from 1979 to present as input for agriculture and agro-ecological studies. This dataset is based on the hourly ECMWF ERA5 data at surface level and is referred to as AgERA5. References: https://doi.org/10.24381/cds.6c68c9bb The Copernicus Climate Change Service (C3S) aims to combine observations of the climate system with the latest science to develop authoritative, quality-assured information about the past, current and future states of the climate in Europe and worldwide. ECMWF operates the Copernicus Climate Change Service on behalf of the European Union and will bring together expertise from across Europe to deliver the service.
-

Reference evapotranspiration per day with a spatial resolution of 0.1 degree. Unit: mm day-1. The dataset contains daily values for global land areas, excluding Antarctica, since 1979. The dataset has been prepared according to the FAO Penman - Monteith method as described in FAO Irrigation and Drainage Paper 56. The input variables are part of the Agrometeorological indicators dataset produced by the European Centre for Medium-Range Weather Forecasts (ECMWF) through the Copernicus Climate Change Service (C3S). The Agrometeorological indicators dataset provides daily surface meteorological data for the period from 1979 to present as input for agriculture and agro-ecological studies. This dataset is based on the hourly ECMWF ERA5 data at surface level and is referred to as AgERA5. References: https://doi.org/10.24381/cds.6c68c9bb The Copernicus Climate Change Service (C3S) aims to combine observations of the climate system with the latest science to develop authoritative, quality-assured information about the past, current and future states of the climate in Europe and worldwide. ECMWF operates the Copernicus Climate Change Service on behalf of the European Union and will bring together expertise from across Europe to deliver the service.
-

The FGGD irrigated areas map is a global raster datalayer with a resolution of 5 arc-minutes. Each pixel in the map contains a value representing the percentage of the area equipped for irrigation. The data are a IIASA modification of FAO and University of Kessel (2002), Digital Global Map of Irrigated Areas v. 2.1. Please for the latest version refer to www.fao.org/ag/agl/aglw/aquastat/irrigationmap/index10.stm
-

Reference evapotranspiration per year with a spatial resolution of 0.1 degree. Unit: mm year-1. The dataset contains annual values for global land areas, excluding Antarctica, since 1979. The dataset has been prepared according to the FAO Penman - Monteith method as described in FAO Irrigation and Drainage Paper 56. The input variables are part of the Agrometeorological indicators dataset produced by the European Centre for Medium-Range Weather Forecasts (ECMWF) through the Copernicus Climate Change Service (C3S). The Agrometeorological indicators dataset provides daily surface meteorological data for the period from 1979 to present as input for agriculture and agro-ecological studies. This dataset is based on the hourly ECMWF ERA5 data at surface level and is referred to as AgERA5. References: https://doi.org/10.24381/cds.6c68c9bb The Copernicus Climate Change Service (C3S) aims to combine observations of the climate system with the latest science to develop authoritative, quality-assured information about the past, current and future states of the climate in Europe and worldwide. ECMWF operates the Copernicus Climate Change Service on behalf of the European Union and will bring together expertise from across Europe to deliver the service.
-
This map, compiled to support the analysis of SOLAW report concerning trends and current use of water use in agriculture, shows the percentage of irrigated area supplied by groundwater. Irrigation mainly relies on renewable freshwater resources, either surface water or groundwater. However, while the extent of irrigation and related water uses are reported in statistical databases or by model simulations, information on the source of irrigation water is still very rare. A recent global inventory undertaken by FAO and the University of Bonn reports that 113 million ha, or 38 percent of the total area equipped for irrigation of 301 million ha, is irrigated by groundwater (Siebert et al, 2010).
-
The FGGD severe environmental constraints map is a global raster datalayer with a resolution of 5 arc-minutes. Pixels with no severe environmental constraints contain a value of zero. Each other pixel contains a cumulative class value that shows which environmental constraint is binding in the pixel area. The data are from FAO and IIASA, 2000, Global agro-ecological zones, as reported in FAO and IIASA, 2007, Mapping biophysical factors that influence agricultural production and rural vulnerability, by H. von Velthuizen et al.
-

GlobWat uses spatially distributed input layers consisting of monthly precipitation, number of wet days per month, coefficient of variation of precipitation, monthly reference evapotranspiration, maximum soil moisture storage capacity, maximum percolation flux, irrigated areas, land use, and areas of open water and wetlands. All these input layers are based on freely available spatial dataset with a resolution of 10 arc minutes for the climate dataset and 5 arc minutes for all the terrain and land dataset (data sources are provided in the downloadable files). The water balance is calculated in two steps. First a vertical water balance is calculated that includes rainfall dependent evapotranspiration and evapotranspiration from crops under irrigated circumstances (for which it is assumed that it can be provided by surface water or groundwater). In a second stage, a horizontal water balance is calculated to correct for incremental evapotranspiration from open water and wetlands and to calculate discharges from river (sub-) basins taking into consideration the water needed for irrigation.