 Stars4Water
population
Type of resources
Available actions
Topics
Keywords
Contact for the resource
Provided by
Formats
Representation types
Update frequencies
status
Scale
-

On 8 November 2013, Typhoon Haiyan made landfall in the Philippines causing widespread devastation, tremendous loss of life and catastrophic impact on infrastructure and natural resources. As a result of the devastating damage to agriculture and fisheries sectors and the severe impact on lives and livelihoods FAO has declared Level 3 Emergency Response. In response to the call for needs assessment and coordinating humanitarian assistance in agriculture and fisheries sectors the FAO, Land and Water Division Geospatial Unit collected a number of datasets from various sources including FAO, WFP, UNITAR-UNOSAT, EC-JRC, USDA, USGS as well as updated reports from national agencies as well as the National Disaster Risk Reduction and Management council. Severity zones were mapped using data from the EC-JRC updates based on the Public Storm Warning Signals (PSWC) in four main levels: S1-very high for PSWC #1, S2-high for PSWC #2, S3-medium for PSWC #3 and S4-medium-low for PSWC#4. The severity area mask was calibrated using remote sensing data combined with the data reported on November 13, 2013 by the National Disaster Risk Reduction and Management Council of Philippines. The severity intensity rate was classified proportionally with the affected population figures. The data on crop production, harvested area, yield for major crops were collected from FAO, Global Spatial Database of Agricultural Land-Use Statistics AgroMaps ( http://kids.fao.org/agromaps ), FAOSTAT ( http://faostat.fao.org/) and Bureau of Agricultural Statistics of Philippines (http://countrystat.bas.gov.ph ). Data on arable land and permanent crops were derived from the FAO Global Land Cover Share database (Beta-version) and data on the area by district were derived by the FAO Global Administrative Units Layer, GAUL version 2013-12 (www.fao.org/geonetwork). In addition data on crop calendars to identify crop growing stage were collected from the FAO-IIASA Global Agro-Ecological Zones Data portal, GAEZ (www.fao.org/nr/gaez) , FAO Crop Calendar from Data@Fao.org (https://data.apps.fao.org/) and FAO Agricultural Market Information System, AMIS (http://www.amis-outlook.org/) .Philippines rice crop calendar was provided by the Philippines Rice Research Institute (PhilRice-DA), International Rice Research Institute (IRRI). The assessment was done by first georefencing, harmonizing and creating a central database in the UTM WGS 84 reference system. Areas of crop growth stages were analyzed according to their stage at the time of the event. Major season and secondary season for rice were considered for analysis at the time of the event. The areas of standing rice at the moment of the event were mapped using the district level crop calendars for the major season. Also the planted rice areas for the second season were mapped. The affected area was then calculated considering both these areas which were considered as area loss, calibrated by the severity intensity rate class. The extent (ha) and fraction (%) of the potential affected crop areas was calculated by intersecting the tropical cyclone severity areas with the administrative layers, arable land and permanent crops, annual harvested area, yield and production for year 2012 (which was used as a proxy to assess the planted area). Major crops which were affected include Rice Paddy, Coconut and Sugar Cane. The maps show the impacts of the tropical cyclone on these crops. The outputs were classified in 5 classes of affected areas: less the 10%, 10-25%, 25-50%, 50-75%, and >75%. The tabular information provides information on the estimated affected area for Rice Paddy (extent in ha and share in percentage) by Typhoon “YOLANDA” (HAIYAN) severity Level and by District (updated on 15 November 2013). The affected planted areas for each severity zone were calculated as a fraction of the planted area versus by severity zone by administrative unit area. In addition, the analysis was done for major livestock, pig, poultry and cattle, affected population. Sources: Agromaps, FAOSTAT, CountrySTAT Philippines, GAEZ, AMIS, GLC-SHARE, FAO NRL Geospatial Unit datasets, Data@FAO.ORG, EC-JRC, ESA GlobCover, UNITAR, UNOSAT, WFP, National Disaster Risk Reduction and Management Council, Republic of Philippines, Philippines rice crop calendar, Philippines Rice Research Institute (PhilRice-DA), International Rice Research Institute (IRRI) sponsored by the DA-National Rice Program via the Rice Self Sufficiency Program (RSSP) and the Global Rice Science Partnership (GRiSP), the CGIAR Research Program on Rice.
-
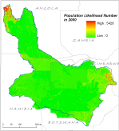
Population database compiled on a 30x30†lat/long grid, for the years: 1998, 2000 and 2007. within the Okavango Basin. Census counts (at sub-national level) were apportioned to each grid cell based on likelihood coefficients, which are based on proximity to roads, slope, land cover, nighttime lights, and other information.Source: Oak Ridge National Laboratory (ORNL). This dataset is part of the GIS Database for the Environment Protection and Sustainable Management of the Okavango River Basin project (EPSMO). Detailed information on the database can be found in the “GIS Database for the EPSMO Project†document produced by Luis Veríssimo (FAO consultant) in July 2009, and here available for download.
-

Soil and terrain suitability for maize dataset, at about 1 km resolution, investigates soil suitability and both soil and terrain suitability for maize, under rain-fed condition, with high and low inputs. The Soil and terrain suitability for crops datasets are part of the GAEZ v4 Theme 1 Land and Water Resources, Soil Suitability sub-theme. In the GAEZ v4 the Soil Suitability assessment sub-theme, soil qualities are evaluated for each crop and input/management level and for different water supply systems (rain-fed and irrigated). The results are crop and input level specific soil suitability ratings, which are used for the crop suitability and attainable yield assessment presented in Theme 4. Terrain suitability is also estimated according to terrain-slope classes and location-specific rainfall amounts and rainfall-concentration characteristics to account for soil erosion risks related to crop cover dynamics. Soil and terrain suitability are combined in an edaphic rating factor by crop, water supply type and input level, which is an important input for the estimation of agro-ecological crop suitability and attainable yields presented in Theme 4. For further details, please refer to the GAEZ v4 Model Documentation.
-

Moisture regime classification at about 9 km resolution at the equator, using different climate data source and based on different Representative Concentration Pathways (RCPs) according to the time period as follows: - climate data source CRUTS32 based on historical data for the time period 1981-2010; - climate data source ENSEMBLE based on the Representative Concentration Pathway RCP8.5 for time periods 2041-2070 and 2071-2100. The Moisture regime classification dataset is part of the GAEZ v4 Theme 1 Land and Water Resources, Agro-Ecological Zones sub-theme. The agro-ecological zones classification provides a characterization of bio-physical resources relevant to agricultural production systems. AEZ definitions and map classes follow a rigorous methodology and an explicit set of principles. The inventory combines spatial layers of thermal and moisture regimes with broad categories of soil/terrain qualities. It also indicates locations of areas with irrigated soils and shows land with severely limiting bio-physical constraints including very cold and very dry (desert) areas as well as areas with very steep terrain or very poor soil/terrain conditions. For further details, please refer to the GAEZ v4 Model Documentation.
-

The quality and availability of land and water resources, together with socio-economic conditions and institutional factors, are essential to assure sustainable food security. GAEZ provides a framework for establishing a spatial inventory of land resources. Global environmental datasets provide the spatial characteristics required for land productivity assessments concerning location-specific agro-ecological conditions. The land resources inventory contains spatial layers of climate, land cover, soil, elevation and terrain slopes, protected areas and areas of high biodiversity value, administrative units, watersheds, population and livestock distribution. Theme 1: Land and Water Resources provides selected layers of the GAEZ v4 land resources database organized in several sub-themes of (1) Agro-ecological Zones, (2) Land Cover, (3) Soil Resources, (4) Soil Suitability, (5) Terrain Resources, (6) Exclusion Areas, (7) Water Resources, and (8) Selected Socio-economic Data. Results of this theme are presented in a regular raster format of 5 arc-minute (about 9 x 9 km at the equator) grid cells. Selected maps related to AEZ classification, soil suitability, terrain slopes and land cover are provided at 30 arc-second (0.9 x 0.9 km) resolution. The GAEZ v4 update includes 2010 baseline data comprising land cover, a harmonized global soil database and terrain data, protected areas and areas of high biodiversity value. Climatic conditions are based on a time series of historical data of 1961-2010 and a selection of future climate simulations (30-year average of years 2011-2040, 2041-2070, and 2070-2099) using recent IPCC AR5 Earth System Model (ESM) outputs for four Representative Concentration Pathways (RCPs). GAEZ methodology development, data base compilation, production of results and establishing the Data Portal were accomplished in close technical collaboration and with inputs of the International Institute for Applied Systems Analysis (IIASA). For further details, please refer to the GAEZ v4 Model Documentation.
-

AEZ classification by climate, soil, terrain and land cover (57 classes) at about 1 km resolution at the equator, using different climate data source and based on different Representative Concentration Pathways (RCPs) according to the time period as follows: - climate data source CRUTS32 based on historical data for the time period 1981-2010; - climate data source ENSEMBLE based on the Representative Concentration Pathway RCP8.5 for time periods 2041-2070 and 2071-2100. The AEZ classification by climate, soil, terrain and land cover dataset is part of the GAEZ v4 Theme 1 Land and Water Resources, Agro-Ecological Zones sub-theme. The agro-ecological zones classification provides a characterization of bio-physical resources relevant to agricultural production systems. AEZ definitions and map classes follow a rigorous methodology and an explicit set of principles. The inventory combines spatial layers of thermal and moisture regimes with broad categories of soil/terrain qualities. It also indicates locations of areas with irrigated soils and shows land with severely limiting bio-physical constraints including very cold and very dry (desert) areas as well as areas with very steep terrain or very poor soil/terrain conditions. For further details, please refer to the GAEZ v4 Model Documentation.
-

Thermal regime classification at about 9 km resolution at the equator, using different climate data source and based on different Representative Concentration Pathways (RCPs) according to the time period as follows: - climate data source CRUTS32 based on historical data for the time period 1981-2010; - climate data source ENSEMBLE based on the Representative Concentration Pathway RCP8.5 for time periods 2041-2070 and 2071-2100. The Thermal regime classification dataset is part of the GAEZ v4 Theme 1 Land and Water Resources, Agro-Ecological Zones sub-theme. The agro-ecological zones classification provides a characterization of bio-physical resources relevant to agricultural production systems. AEZ definitions and map classes follow a rigorous methodology and an explicit set of principles. The inventory combines spatial layers of thermal and moisture regimes with broad categories of soil/terrain qualities. It also indicates locations of areas with irrigated soils and shows land with severely limiting bio-physical constraints including very cold and very dry (desert) areas as well as areas with very steep terrain or very poor soil/terrain conditions. For further details, please refer to the GAEZ v4 Model Documentation.
-
Dominant AEZ classification (33 classes) at about 9 km resolution at the equator, using different climate data source and based on different Representative Concentration Pathways (RCPs) according to the time period as follows: - climate data source CRUTS32 based on historical data for the time period 1981-2010; - climate data source ENSEMBLE based on the Representative Concentration Pathway RCP8.5 for time periods 2041-2070 and 2071-2100. The Dominant AEZ classification dataset is part of the GAEZ v4 Theme 1 Land and Water Resources, Agro-Ecological Zones sub-theme. The agro-ecological zones classification provides a characterization of bio-physical resources relevant to agricultural production systems. AEZ definitions and map classes follow a rigorous methodology and an explicit set of principles. The inventory combines spatial layers of thermal and moisture regimes with broad categories of soil/terrain qualities. It also indicates locations of areas with irrigated soils and shows land with severely limiting bio-physical constraints including very cold and very dry (desert) areas as well as areas with very steep terrain or very poor soil/terrain conditions. For further details, please refer to the GAEZ v4 Model Documentation.
-

Simplified AEZ classification (33 classes) at about 1 km resolution at the equator, using different climate data source and based on different Representative Concentration Pathways (RCPs) according to the time period as follows: - climate data source CRUTS32 based on historical data for the time period 1981-2010; - climate data source ENSEMBLE based on the Representative Concentration Pathway RCP8.5 for time periods 2041-2070 and 2071-2100. The Simplified AEZ classification dataset is part of the GAEZ v4 Theme 1 Land and Water Resources, Agro-Ecological Zones sub-theme. The agro-ecological zones classification provides a characterization of bio-physical resources relevant to agricultural production systems. AEZ definitions and map classes follow a rigorous methodology and an explicit set of principles. The inventory combines spatial layers of thermal and moisture regimes with broad categories of soil/terrain qualities. It also indicates locations of areas with irrigated soils and shows land with severely limiting bio-physical constraints including very cold and very dry (desert) areas as well as areas with very steep terrain or very poor soil/terrain conditions. For further details, please refer to the GAEZ v4 Model Documentation.