 Stars4Water
soil
Type of resources
Available actions
Topics
Keywords
Contact for the resource
Provided by
Years
Formats
Representation types
Update frequencies
status
Scale
Resolution
-

The FGGD soils map is a global raster datalayer with a resolution of 5 arc-minutes. Each pixel contains a class value for the major soil group found in the pixel area. The data are from FAO and IIASA, 2000, Global agro-ecological zones, as reported in FAO and IIASA, 2007, Mapping biophysical factors that influence agricultural production and rural vulnerability, by H. von Velthuizen et al.
-
The FGGD soil constraints map is a global raster datalayer with a resolution of 5 arc-minutes. Each pixel contains a class value for the degree to which soil characteristics constrain agricultural production potential in the pixel area. The data are from FAO and IIASA, 2000, Global agro-ecological zones, as reported in FAO and IIASA, 2007, Mapping biophysical factors that influence agricultural production and rural vulnerability, by H. von Velthuizen et al.
-
The Food and Agriculture Organization of the United Nations (FAO) with the collaboration of the International Institute for Applied Systems Analysis (IIASA), has developed a system that enables rational land-use planning on the basis of an inventory of land resources and evaluation of biophysical limitations and potentials. This is referred to as the Agro-ecological Zones (AEZ) methodology.
-
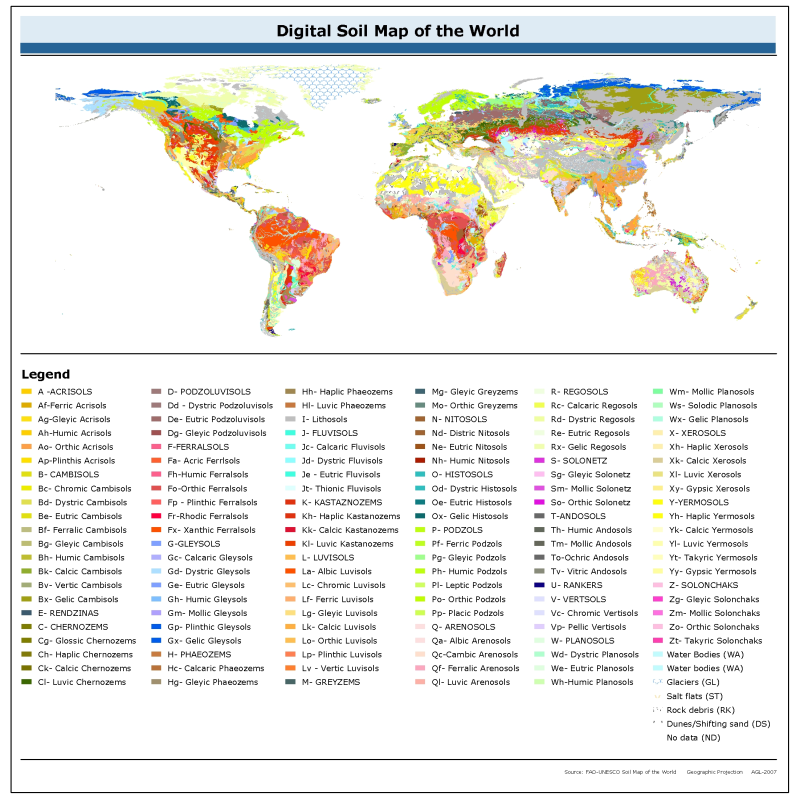
The vector data set is based on the FAO-UNESCO Soil Map of the World. The Digitized Soil Map of the World, at 1:5.000.000 scale, is in the Geographic projection (Latitude - Longitude) intersected with a template containing water related features (coastlines, lakes, glaciers and double-lined rivers). The Digital Soil Map of the World (except for the continent of Africa) was intersected with the Country Boundaries map from the World Data Bank II (with country boundaries updated to January 1994 at 1:3 000 000 scale), obtained from the US Government. For Africa, the country boundaries are derived from the FAO Country Boundaries on the original FAO/UNESCO Soil Map of the World. Country boundaries in both cases were checked and adjusted in certain places on the basis of FAO and UN conventions. The maps (jpg and pdf) are also available on the FAO soil Portal together with their reports for the following regions : North America, Mexico and Central America, South America, Europe, Asia, South Asia, Nortah and Central Asia, Sourtheast Asia and Australasia. [http://www.fao.org/soils-portal/soil-survey/soil-maps-and-databases/faounesco-soil-map-of-the-world/en/]
-
The Food and Agriculture Organization of the United Nations (FAO) with the collaboration of the International Institute for Applied Systems Analysis (IIASA), has developed a system that enables rational land-use planning on the basis of an inventory of land resources and evaluation of biophysical limitations and potentials. This is referred to as the Agro-ecological Zones (AEZ) methodology.
-
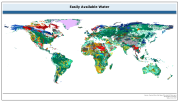
The raster dataset of easily available water has a spatial resolution of 5 * 5 arc minutes and is in geographic projection. Information with regard to available water was obtained from the "Derived Soil Properties" of the FAO-UNESCO Soil Map of the World which contains raster information on soil properties.
-
The Food and Agriculture Organization of the United Nations (FAO) with the collaboration of the International Institute for Applied Systems Analysis (IIASA), has developed a system that enables rational land-use planning on the basis of an inventory of land resources and evaluation of biophysical limitations and potentials. This is referred to as the Agro-ecological Zones (AEZ) methodology.
-

GSOCmap is the first global soil organic carbon map ever produced through a consultative and participatory process involving member countries, which makes this map totally new and unique. In fact, the map was prepared by member countries, under the guidance of the Intergovernmental Technical Panel on Soils and the Global Soil Partnership Secretariat. Countries agreed on the methodology to produce the map and were trained on modern tools and methodologies to develop national maps. The Global Soil Partnership then gathered all national maps to produce the final product, ensuring a thorough harmonization process. Note: The dataset comes along with a technical report which presents methodologies and the process of compiling the Global Soil organic Carbon Map. The link to download the report is available in the on-line resources.
-
This map represents the spatial distribution of land under irrigation which is affected by some degree of salinization. It was produced by combining FAO AQUASTAT country statistics regarding irrigated areas affected by salinization with spatial information on irrigated areas where precipitation is not sufficient to leach away salt residues that are built up in the soil due to irrigation. It was assumed that the risk of salinization of irrigated areas can occur only in areas with an Aridity Index lower than 0.65 (where the Aridity Index is defined as Yearly Precipitation divided by Yearly Reference Evapotranspiration).