 Stars4Water
hydrology
Type of resources
Available actions
Topics
Keywords
Contact for the resource
Provided by
Years
Formats
Representation types
Update frequencies
status
Scale
-

This map provides a representation of levels of water scarcity by major hydrological basin, expressed in terms of the ratio between irrigation water that is consumed by plants through evapotranspiration and renewable fresh water resources. Contrarily to previous water scarcity maps, this map uses consumptive use of water rather than water withdrawal. Renewable fresh water resources as well as net irrigation water requirements in the river basin are calculated through a water balance model, with information regarding climate, soils and irrigated agriculture as input data. The legend distinguishes three classes: • Water scarcity in river basins where evapotranspiration due to irrigation is less than 10% of the total renewable water resources is classified as low; • Water scarcity in river basins where evapotranspiration due to irrigation is in between 10% and 20% of the total renewable water resources is classified as moderate; • Water scarcity in river basins where evapotranspiration due to irrigation is more than 20% of the total renewable water resources is classified as high.
-
This map shows the extent of land area equipped for irrigation -expressed as percentage- around the turn of the 20th century according to the Global Map of Irrigation Areas (version 4.0.1), together with areas of rainfed agriculture. Data are available from AQUASTAT - programme of the Land and Water Division of the Food and Agriculture Organization of the United Nations.
-

The FGGD irrigated areas map is a global raster datalayer with a resolution of 5 arc-minutes. Each pixel in the map contains a value representing the percentage of the area equipped for irrigation. The data are a IIASA modification of FAO and University of Kessel (2002), Digital Global Map of Irrigated Areas v. 2.1. Please for the latest version refer to www.fao.org/ag/agl/aglw/aquastat/irrigationmap/index10.stm
-

GlobWat uses spatially distributed input layers consisting of monthly precipitation, number of wet days per month, coefficient of variation of precipitation, monthly reference evapotranspiration, maximum soil moisture storage capacity, maximum percolation flux, irrigated areas, land use, and areas of open water and wetlands. All these input layers are based on freely available spatial dataset with a resolution of 10 arc minutes for the climate dataset and 5 arc minutes for all the terrain and land dataset (data sources are provided in the downloadable files). The water balance is calculated in two steps. First a vertical water balance is calculated that includes rainfall dependent evapotranspiration and evapotranspiration from crops under irrigated circumstances (for which it is assumed that it can be provided by surface water or groundwater). In a second stage, a horizontal water balance is calculated to correct for incremental evapotranspiration from open water and wetlands and to calculate discharges from river (sub-) basins taking into consideration the water needed for irrigation.
-
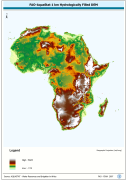
WRIA_DEM: Hydrologically filled GTopo30 DEM with the main stems of cartographic rivers "burned-in" for irrigation analysis. GT30/GTopo30 is Global Topographic 30 arc second DEM database, nominal 1km postings; DEM is Digital Elevation Model. The WRIALAEA grid data layer is comprised of 9194x8736 derivative raster hydrologically filled dem features derived based on 1 kilometer data originally from FAO.
-
This map, compiled to support the analysis of SOLAW report concerning trends and current use of water use in agriculture, shows the percentage of irrigated area supplied by groundwater. Irrigation mainly relies on renewable freshwater resources, either surface water or groundwater. However, while the extent of irrigation and related water uses are reported in statistical databases or by model simulations, information on the source of irrigation water is still very rare. A recent global inventory undertaken by FAO and the University of Bonn reports that 113 million ha, or 38 percent of the total area equipped for irrigation of 301 million ha, is irrigated by groundwater (Siebert et al, 2010).
-

Global Map of Irrigation Areas - Version 5 Grid with percentage of area equipped for irrigation with a spatial resolution of 5 arc minutes or 0.083333 decimal degrees. This dataset is developed in the framework of the AQUASTAT Programme of the Land and Water Division of the Food and Agriculture Organization of the United Nations and the Rheinische Friedrich-Wilhems University, Germany. The map shows the amount of area equipped for irrigation around the year 2005 in percentage of the total area on a raster with a resolution of 5 minutes. Additional map layers show the percentage of the area equipped for irrigation that was actually used for irrigation and the percentages of the area equipped for irrigation that was irrigated with groundwater, surface water or non-conventional sources of water. In details, the following products have been released and made available for download: (A) Area equipped for irrigation expressed as percentage of total area: total=aei, surface water=aeisw, groundwater=aeigw, non-conventional sources of water=aeinc (ASCII-grid); (B) Area actually irrigated expressed as percentage of area equipped for irrigation (ASCII-grid); (C) Area equipped for irrigation expressed in hectares per cell (ASCII-grid); (D) Irrigated areas v.5 (ESRI shapefile); (E) High and low resolution images (PDF); (F) Quality Assessment (Excel) Due to the map generation method, the quality of the map can never be uniform. The overall quality of the map depends heavily on the individual quality of the data for the different countries.
-
This map represents the spatial distribution of land under irrigation which is affected by some degree of salinization. It was produced by combining FAO AQUASTAT country statistics regarding irrigated areas affected by salinization with spatial information on irrigated areas where precipitation is not sufficient to leach away salt residues that are built up in the soil due to irrigation. It was assumed that the risk of salinization of irrigated areas can occur only in areas with an Aridity Index lower than 0.65 (where the Aridity Index is defined as Yearly Precipitation divided by Yearly Reference Evapotranspiration).
-
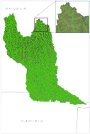
This vector layer (point) represents the points at which stream segments intersect in the CORB-Contributing area, and can aid in the identified of locations for potential hydrological monitoring. This was created by an interpolation of all stream intersections in the Drainage Line layer. This dataset is part of the GIS Database for the Environment Protection and Sustainable Management of the Okavango River Basin project (EPSMO). Detailed information on the database can be found in the “GIS Database for the EPSMO Project†document produced by Luis Veríssimo (FAO consultant) in July 2009, and here available for download.
-
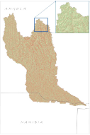
This vector layer (polygon) - reference scale 1/200 000 - also identifies the catchment area for each stream segment in the CORB-Contributing area. The value for each polygon corresponds to the value carried by the stream segment that drains that area, defined in the Stream Segmentation grid. Source: This layer was created by converting the Catchment Grid raster layer into vector format. This dataset is part of the GIS Database for the Environment Protection and Sustainable Management of the Okavango River Basin project (EPSMO). Detailed information on the database can be found in the “GIS Database for the EPSMO Project†document produced by Luis Veríssimo (FAO consultant) in July 2009, and here available for download.