 Stars4Water
biota
Type of resources
Available actions
Topics
Keywords
Contact for the resource
Provided by
Years
Formats
Representation types
Update frequencies
status
Scale
-
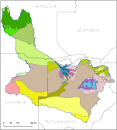
This vector layer delineates the phytogeographic units within the Okavango Basin. Source: Several (FAO, WCMC, Phytogeographic Chart of Angola). Irreconcilable adjustments between Namibia and Botswana. This dataset is part of the GIS Database for the Environment Protection and Sustainable Management of the Okavango River Basin project (EPSMO). Detailed information on the database can be found in the “GIS Database for the EPSMO Project†document produced by Luis Veríssimo (FAO consultant) in July 2009, and here available for download.
-

Vegetation classes according to White's (1983) classification within the Okavango Basin. Source: Vegetation Map of Africa, White 1983, UNESCO/AETFAT/UNSO. This dataset is part of the GIS Database for the Environment Protection and Sustainable Management of the Okavango River Basin project (EPSMO). Detailed information on the database can be found in the “GIS Database for the EPSMO Project†document produced by Luis Veríssimo (FAO consultant) in July 2009, and here available for download.
-
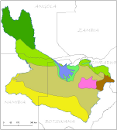
Distribution of Ecoregions within the Okavango Basin. Source: World Wild Life Fund (WWF). This dataset is part of the GIS Database for the Environment Protection and Sustainable Management of the Okavango River Basin project (EPSMO). Detailed information on the database can be found in the “GIS Database for the EPSMO Project†document produced by Luis Veríssimo (FAO consultant) in July 2009, and here available for download.
-
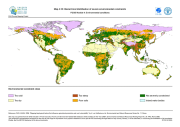
The FGGD severe environmental constraints map is a global raster datalayer with a resolution of 5 arc-minutes. Pixels with no severe environmental constraints contain a value of zero. Each other pixel contains a cumulative class value that shows which environmental constraint is binding in the pixel area. The data are from FAO and IIASA, 2000, Global agro-ecological zones, as reported in FAO and IIASA, 2007, Mapping biophysical factors that influence agricultural production and rural vulnerability, by H. von Velthuizen et al.
-
Eco-climatic zones were produced taking into account land-surface and atmospheric characteristics (the photosynthetic activity, the temperature of the earth?s surface, the atmospheric drying power, the rainfall, the potential evapotranspiration, the length of growing period for plants, the surface elevation). Most of these features could be accurately predicted using satellite data; some others needed a combination of remotely sensed and ground-based data. Remotely sensed data were acquired by NOAA-AVHRR sensor and by Meteosat satellite. The AVHRR satellite data were available in dekadal images for a 13 year series from 1982-1994. Meteosat imagery runs from 1988 to 1997. The information layer was produced for FAO in January 1999 by Environmental Research Group Oxford (ERGO Ltd) in collaboration with the Trypanosomosis and Land Use in Africa (TALA) research group at the Department of Zoology, University of Oxford.
-

This dataset forms part of a global livestock mapping project by the Food and Agriculture Organization's Animal Production and Health Division (FAO-AGA). The methodology and sources of data are fully described in a document entitled: "The Gridded Livestock of the World FAO (2007)". In summary, for each country the most recent available sub-national livestock census data and corresponding administrative boundaries have been collected. These are then converted into densities, excluding land unsuitable for livestock (either monogastric or ruminant), to provide the 'observed' data. The data are then disaggregated based on statistical relations with some environmental variables in similar agro-ecological zones to produce the 'predicted' distribution. The predicted data are further manipulated to match national census totals for the year 2000 and the year 2005 according to the FAOSTAT database. The project includes: a global network of data providers on livestock and sub-national boundaries; an Oracle database in which these data are managed and processed; a system for predicting livestock distributions based on environmental data and an interactive web application, the Global Livestock Production and Health Atlas (GLiPHA - http://www.fao.org/ag/aga/glipha/index.jsp), through which data are viewed and disseminated. The files are in a raster GRID format, with an ArcGis layer file and an ArcView legend file. Pixel values represent actual densities (per square kilometre). Projection details are given in the metadata. The map should ideally be viewed with the overlay of national boundaries, water bodies and unsuitable land. All of these supplementary data are available in accompanying zip files. These data have been produced by FAO's Animal Production and Health Division in collaboration with ERGO and the TALA research group, University of Oxford, UK.
-
This dataset forms part of a global livestock mapping project by the Food and Agriculture Organization's Animal Production and Health Division (FAO-AGA). The methodology and sources of data are fully described in a document entitled: "The Gridded Livestock of the World FAO (2007)". In summary, for each country the most recent available sub-national livestock census data and corresponding administrative boundaries have been collected. These are then converted into densities, excluding land unsuitable for livestock (either monogastric or ruminant), to provide the 'observed' data. The data are then disaggregated based on statistical relations with some environmental variables in similar agro-ecological zones to produce the 'predicted' distribution. The predicted data are further manipulated to match national census totals for the year 2000 and the year 2005 according to the FAOSTAT database. The project includes: a global network of data providers on livestock and sub-national boundaries; an Oracle database in which these data are managed and processed; a system for predicting livestock distributions based on environmental data and an interactive web application, the Global Livestock Production and Health Atlas (GLiPHA - http://kids.fao.org/glipha/), through which data are viewed and disseminated. The files are in a raster GRID format, with an ArcGis layer file and an ArcView legend file. Pixel values represent actual densities (per square kilometre). Projection details are given in the metadata. The map should ideally be viewed with the overlay of national boundaries, water bodies and unsuitable land. All of these supplementary data are available in accompanying zip files. These data have been produced by FAO's Animal Production and Health Division in collaboration with ERGO and the TALA research group, University of Oxford, UK.