 Stars4Water
land cover
Type of resources
Available actions
Topics
Keywords
Contact for the resource
Provided by
Years
Formats
Representation types
Update frequencies
status
Scale
Resolution
-
This map builds upon work done by Dixon (Dixon et al., 2001) in an attempt to propose a general classification of major farming systems. Based on a combination of global dataset, the map proposes a harmonized classification of major agricultural systems used as the basis for the analysis of SOLAW's Systems at risk. The map is based on an interpretation of global land cover data, combined with thematic datasets showing irrigated land and paddy rice extent. The map is published in SOLAW Report: The state of the world's land and water resources for food and agriculture - Managing systems at risk (2011) and SOLAW Thematic Report 15: Sustainable options for addressing land and water problems - a problem tree and case studies (links in the online resources section).
-
The map shows the total annual water withdrawal. Water withdrawals are downscaled to to a five arc-minute grid. Water is considered scarce when the withdrawals exceed 40% of the renewable resource. According to statistics compiled by FAO (FAOSTAT), several countries in North Africa, the Middle East and Central Asia withdraw more water than their total renewable resources. Domestic water withdrawals are downscaled by applying the per capita domestic water use to population of each pixel. Industrial water withdrawals were downscaled by using the industrial water use per unit GDP and applying downscaled information on GDP. Water consumption is assumed to be 30% of domestic use and 10% of industrial use. Finally, agricultural water consumption is assumed to be the crop water deficit in irrigated areas generated in the AEZ analysis and water used for livestock consumption, applied to a global spatial data set of livestock distribution prepared by FAO. Source of the map: GAEZ 2009 and AQUASTAT; downscaling simulations by authors.
-

The map summarizes the status of the land use and land cover at global scale. It was compiled according to the current GAEZ (Global Agro-Ecological Zones) -2009 approach, developed by FAO in collaboration with IIASA (International Institute for Applied Systems Analysis).The current Global AEZ (GAEZ-2009) offers a standardized framework for the characterization of climate, soil and terrain conditions relevant to agricultural production, which can be applied at global to sub-national levels. The map is based on six geographic datasets: - GLC2000 land cover database at 30 arc-sec (http://www-gvm.jrc.it/glc2000), using regional and global legends (JRC, 2006); - an IFPRI global land cover categorization providing 17 land cover classes at 30 arc-sec. (IFPRI, 2002), based on a reinterpretation of the Global Land Cover Characteristics Database (GLCC ver. 2.0), EROS Data Centre (EDC, 2000); - FAO’s Global Forest Resources Assessment 2000 and 2005 (FAO, 2001; FAO, 2006) at 30 arc-sec. resolution; - digital Global Map of Irrigated Areas (GMIA) version 4.0 of (FAO/University of Frankfurt) at 5’ by 5’ latitude/longitude resolution, providing by grid-cell the percentage land area equipped with irrigation infrastructure (Siebert et al., 2007); - a spatial population density inventory (30-arc seconds) for year 2000 developed by FAO-SDRN, based on spatial data of LANDSCAN 2003, with calibration to UN 2000 population figures. An iterative calculation procedure has been implemented to estimate land cover class weights, consistent with aggregate FAO land statistics and spatial land cover patterns obtained from remotely sensed data, allowing the quantification of major land use/land cover shares in individual 5’ by 5’ latitude/longitude grid cells.
-
The map shows the ratio of total withdrawals to the available renewable water resource. Renewable water resources are downscaled to a five arc-minute grid. Water is considered scarce when the withdrawals exceed 40% of the renewable resource. According to statistics compiled by FAO (FAOSTAT),several countries in North Africa, the Middle East and Central Asia withdraw more water than their total renewable resources. Domestic water withdrawals are downscaled by applying the per capita domestic water use to population of each pixel. Industrial water withdrawals were downscaled by using the industrial water use per unit GDP and applying downscaled information on GDP. Water consumption is assumed to be 30% of domestic use and 10% of industrial use. Finally, agricultural water consumption is assumed to be the crop water deficit in irrigated areas generated in the AEZ analysis and water used for livestock consumption, applied to a global spatial data set of livestock distribution prepared by FAO.Source of the map: GAEZ 2009 and AQUASTAT; downscaling simulations by authors.
-

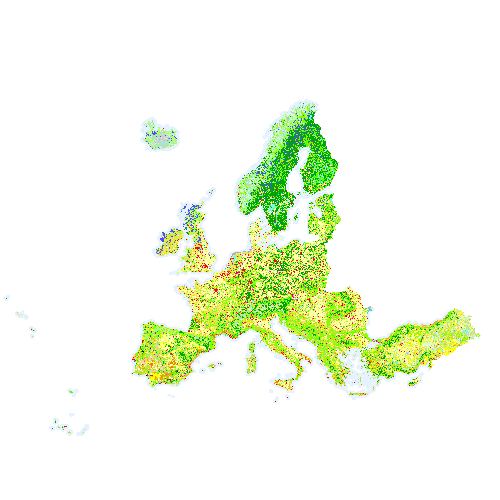
Corine Land Cover 2018 (CLC2018) is one of the Corine Land Cover (CLC) datasets produced within the frame the Copernicus Land Monitoring Service referring to land cover / land use status of year 2018. CLC service has a long-time heritage (formerly known as "CORINE Land Cover Programme"), coordinated by the European Environment Agency (EEA). It provides consistent and thematically detailed information on land cover and land cover changes across Europe. CLC datasets are based on the classification of satellite images produced by the national teams of the participating countries - the EEA members and cooperating countries (EEA39). National CLC inventories are then further integrated into a seamless land cover map of Europe. The resulting European database relies on standard methodology and nomenclature with following base parameters: 44 classes in the hierarchical 3-level CLC nomenclature; minimum mapping unit (MMU) for status layers is 25 hectares; minimum width of linear elements is 100 metres. Change layers have higher resolution, i.e. minimum mapping unit (MMU) is 5 hectares for Land Cover Changes (LCC), and the minimum width of linear elements is 100 metres. The CLC service delivers important data sets supporting the implementation of key priority areas of the Environment Action Programmes of the European Union as e.g. protecting ecosystems, halting the loss of biological diversity, tracking the impacts of climate change, monitoring urban land take, assessing developments in agriculture or dealing with water resources directives. CLC belongs to the Pan-European component of the Copernicus Land Monitoring Service (https://land.copernicus.eu/), part of the European Copernicus Programme coordinated by the European Environment Agency, providing environmental information from a combination of air- and space-based observation systems and in-situ monitoring. Additional information about CLC product description including mapping guides can be found at https://land.copernicus.eu/user-corner/technical-library/. CLC class descriptions can be found at https://land.copernicus.eu/user-corner/technical-library/corine-land-cover-nomenclature-guidelines/html/.
-
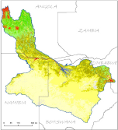
This raster layer represents the land cover classification within the Okavango Basin. Source: Generated under the GIS EPSMO program (Classification based on MODIS Vegetation Continues Fields data from 2000-2005). This dataset is part of the GIS Database for the Environment Protection and Sustainable Management of the Okavango River Basin project (EPSMO). Detailed information on the database can be found in the “GIS Database for the EPSMO Project†document produced by Luis Veríssimo (FAO consultant) in July 2009, and here available for download.
-
Corine Land Cover 2018 (CLC2018) is one of the Corine Land Cover (CLC) datasets produced within the frame the Copernicus Land Monitoring Service referring to land cover / land use status of year 2018. CLC service has a long-time heritage (formerly known as "CORINE Land Cover Programme"), coordinated by the European Environment Agency (EEA). It provides consistent and thematically detailed information on land cover and land cover changes across Europe. CLC datasets are based on the classification of satellite images produced by the national teams of the participating countries - the EEA members and cooperating countries (EEA39). National CLC inventories are then further integrated into a seamless land cover map of Europe. The resulting European database relies on standard methodology and nomenclature with following base parameters: 44 classes in the hierarchical 3-level CLC nomenclature; minimum mapping unit (MMU) for status layers is 25 hectares; minimum width of linear elements is 100 metres. Change layers have higher resolution, i.e. minimum mapping unit (MMU) is 5 hectares for Land Cover Changes (LCC), and the minimum width of linear elements is 100 metres. The CLC service delivers important data sets supporting the implementation of key priority areas of the Environment Action Programmes of the European Union as e.g. protecting ecosystems, halting the loss of biological diversity, tracking the impacts of climate change, monitoring urban land take, assessing developments in agriculture or dealing with water resources directives. CLC belongs to the Pan-European component of the Copernicus Land Monitoring Service (https://land.copernicus.eu/), part of the European Copernicus Programme coordinated by the European Environment Agency, providing environmental information from a combination of air- and space-based observation systems and in-situ monitoring. Additional information about CLC product description including mapping guides can be found at https://land.copernicus.eu/user-corner/technical-library/. CLC class descriptions can be found at https://land.copernicus.eu/user-corner/technical-library/corine-land-cover-nomenclature-guidelines/html/.
-
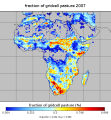
Dataset with information on fractions of different crop types /CFTs at different land cover fractions based on the Synergetic Land Cover Product (SYNMAP), at global scale and for the African continent. SYNMAP is an improved global land cover product with 48 classes at 1-km spatial resolution, reflecting global land covers around year 2000. It fuses different global land cover products, including, Global Land Cover Characterization Database (GLCC), GLC2000, and the 2001 MODIS land cover product, based on fuzzy agreement, which highlights individual strengths and weaknesses of mapping approaches. The overall advantage of the SYNMAP legend is that all classes are properly defined in terms of plant functional types mixtures, which can be remotely sensed and include the definitions of leaf type and longevity for each class with a tree component. This data set has been produced in the framework of the "Climate change predictions in Sub-Saharan Africa: impacts and adaptations (ClimAfrica)" project, Work Package 1 (WP1). WP1 (Past climate variability) aimed to provide consolidated data to other WPs in ClimAfrica, and to analyze the interactions between climate variability, water availability and ecosystem productivity of Sub-Saharan Africa. Various data streams that diagnose the variability of the climate, in particular the water cycle, and the productivity of ecosystems in the past decades, have been collected, analyzed and synthesized. The data streams range from ground-based observations and satellite remote sensing to model simulations. More information on ClimAfrica project is provided in the Supplemental Information section of this metadata.
-

Soil and terrain suitability for maize dataset, at about 1 km resolution, investigates soil suitability and both soil and terrain suitability for maize, under rain-fed condition, with high and low inputs. The Soil and terrain suitability for crops datasets are part of the GAEZ v4 Theme 1 Land and Water Resources, Soil Suitability sub-theme. In the GAEZ v4 the Soil Suitability assessment sub-theme, soil qualities are evaluated for each crop and input/management level and for different water supply systems (rain-fed and irrigated). The results are crop and input level specific soil suitability ratings, which are used for the crop suitability and attainable yield assessment presented in Theme 4. Terrain suitability is also estimated according to terrain-slope classes and location-specific rainfall amounts and rainfall-concentration characteristics to account for soil erosion risks related to crop cover dynamics. Soil and terrain suitability are combined in an edaphic rating factor by crop, water supply type and input level, which is an important input for the estimation of agro-ecological crop suitability and attainable yields presented in Theme 4. For further details, please refer to the GAEZ v4 Model Documentation.
-

Moisture regime classification at about 9 km resolution at the equator, using different climate data source and based on different Representative Concentration Pathways (RCPs) according to the time period as follows: - climate data source CRUTS32 based on historical data for the time period 1981-2010; - climate data source ENSEMBLE based on the Representative Concentration Pathway RCP8.5 for time periods 2041-2070 and 2071-2100. The Moisture regime classification dataset is part of the GAEZ v4 Theme 1 Land and Water Resources, Agro-Ecological Zones sub-theme. The agro-ecological zones classification provides a characterization of bio-physical resources relevant to agricultural production systems. AEZ definitions and map classes follow a rigorous methodology and an explicit set of principles. The inventory combines spatial layers of thermal and moisture regimes with broad categories of soil/terrain qualities. It also indicates locations of areas with irrigated soils and shows land with severely limiting bio-physical constraints including very cold and very dry (desert) areas as well as areas with very steep terrain or very poor soil/terrain conditions. For further details, please refer to the GAEZ v4 Model Documentation.