 Stars4Water
Imagery base maps earth cover
Type of resources
Available actions
Topics
Keywords
Contact for the resource
Provided by
Years
Formats
Representation types
Update frequencies
status
Scale
Resolution
-

The FGGD irrigated areas map is a global raster datalayer with a resolution of 5 arc-minutes. Each pixel in the map contains a value representing the percentage of the area equipped for irrigation. The data are a IIASA modification of FAO and University of Kessel (2002), Digital Global Map of Irrigated Areas v. 2.1. Please for the latest version refer to www.fao.org/ag/agl/aglw/aquastat/irrigationmap/index10.stm
-

The Food and Agriculture Organization of the United Nations (FAO) with the collaboration of the International Institute for Applied Systems Analysis (IIASA), has developed a system that enables rational land-use planning on the basis of an inventory of land resources and evaluation of biophysical limitations and potentials. This is referred to as the Agro-ecological Zones (AEZ) methodology.
-
This dataset is one derivative product from GAEZ v4 for year 2015 that includes gridded (5-arcminute resolution) irrigated and rainfed crop production and crop yield for 26 different crops/crop categories (please see GAEZ_2015_Dimenision_crops.csv for the full list). For each country, the harvested area for each crop was extracted from the FAOSTAT database (http://www.fao.org/faostat/en/#data/QC; data downloaded April 2020). The three years average (2009-2011) of annual national crop harvested area data was considered to represent 2010 national crop harvest area, and the three years average (2014-2016) of annual crop harvested area data to represent 2015 national crop harvest area. The GAEZ v4.0 global gridded (5-arcminute) 2010 crop harvest area product (Fischer et al., 2021) was used as base layer for generating the updated crop harvested area for year 2015. For each grid cell, the crop harvested area in the 2010 product was multiplied by the fractional change from 2010 to 2015 in harvested area for that crop and country. In cases where a grid cell shares its area between multiple countries, the country area-fraction weighted-average was used for the calculation of the given crop. Note, a cell table of country fractions in the given cell (f_(m,i)^k) was based on the Global Administrative Unit Layers (GAUL) of FAO (http://www.fao.org/geonetwork/srv/en/metadata.show?id=12691). Unit of measure Crop harvested area: 1000 ha (10e7 m2) per 5-arcminute grid cell More information about this global gridded crop harvest area, crop production, and crop yield and selected crops dataset is available in the full metadata at https://data.apps.fao.org/map/catalog/srv/eng/catalog.search#/metadata/74bab234-3a1e-442d-93cf-0b34859e9a60
-
This dataset, GAEZ+_2015, provides global, gridded (5-arcminute resolution) irrigated and rainfed crop harvested areas, irrigated and rainfed crop production, and irrigated and rainfed crop yield for 26 different crops/crop categories (please see GAEZ_2015 crops.csv for the full list). This new product is an update to 2015 of the Global Agro-Ecological Zones (GAEZ) Version 4 data of c.2010 crop harvested area (Fischer et al. 2012; note GAEZ v4.0 is not published, this citation is to v3.0). This product is based on national statistics and ignores changes in the spatial distribution of cropland. It was developed as an intermediate product for studies that rely on GAEZ data, providing more recent data on production, yield, and harvested areas. It is not meant to depict the spatial distribution of crops at the pixel level in 2015 accurately, and will become obsolete as soon as a more formal update of GAEZ becomes available that updates pixel level data using the GAEZ methodology. This new product updates the 2010 GAEZ crop harvest area, crop production, and crop yield maps (Fischer et al., 2012), using national-scale data on the fractional change in crop harvested area and production from 2010 to 2015, based on statistics for 160 crops from FAOSTAT (http://www.fao.org/faostat/en/#data/QA). More information on the methodology is available in the Data Quality sections of this metadata.
-
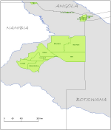
Delineation of Communal Conservancies in Namibia, that share geographical overlapping with the Okavango Basin. Source: Ministry of Agriculture, Water and Forestry of Namibia. This dataset is part of the GIS Database for the Environment Protection and Sustainable Management of the Okavango River Basin project (EPSMO). Detailed information on the database can be found in the “GIS Database for the EPSMO Project†document produced by Luis Veríssimo (FAO consultant) in July 2009, and here available for download.
-

The datasets represent monthly Sensible and Latent Heat Flux at 0.5 degree spatial resolution from 1982 - 2010 over the African continent. For a detailed description of the data sets see: Jung, M. et all. (2011) Global patterns of land-atmosphere fluxes of carbon dioxide, latent heat, and sensible heat derived from eddy covariance, satellite, and meteorological observations. Journal of Geophysical Research - Biogeosciences, 116, doi:10.1029/2010JG001566. request by email. This data set has been produced in the framework of the "Climate change predictions in Sub-Saharan Africa: impacts and adaptations (ClimAfrica)" project, Work Package 1 (WP1). WP1 (Past climate variability) aimed to provide consolidated data to other WPs in ClimAfrica, and to analyze the interactions between climate variability, water availability and ecosystem productivity of Sub-Saharan Africa. Various data streams that diagnose the variability of the climate, in particular the water cycle, and the productivity of ecosystems in the past decades, have been collected, analyzed and synthesized. The data streams range from ground-based observations and satellite remote sensing to model simulations. More information on ClimAfrica project is provided in the Supplemental Information section of this metadata.
-
This dataset is one derivative product from GAEZ v4 for year 2015 that includes gridded (5-arcminute resolution) irrigated and rainfed crop harvested area and crop yield for 26 different crops/crop categories (please see GAEZ_2015_Dimension_crops.csv for the full list). For each country, the production for each crop was extracted from the FAOSTAT database (http://www.fao.org/faostat/en/#data/QC; data downloaded April 2020). The three years average (2009-2011) of annual national crop production data was considered to represent 2010 national crop production, and the three years average (2014-2016) of annual crop production data to represent 2015 national crop production. The method for updating crop production from 2010 to 2015 was the same as described for crop harvested area, except using the 2010 national crop areas, A_(P_(m,2010))^k and the crop production ratio FP,m,i. Unit of measure Crop Production: 1000 tonnes (10e6 kg) per 5-arcminute grid cell More information about this global gridded crop harvest area, crop production, and crop yield and selected crops dataset is available in the full metadata at https://data.apps.fao.org/map/catalog/srv/eng/catalog.search#/metadata/74bab234-3a1e-442d-93cf-0b34859e9a60
-

A consistent and harmonized product of satellite observed fraction of absorbed photosynthetically active radiation (FAPAR). FAPAR is a biophysical variable that indicates the state and health of the vegetation. This data set provides monthly FAPAR from 1982 until 2010 at global scale and for the African continent. The construction of the data set made use of existing products from AVHRR, SeaWiFS and MERIS satellite sensors. This data set has been produced in the framework of the "Climate change predictions in Sub-Saharan Africa: impacts and adaptations (ClimAfrica)" project, Work Package 1 (WP1). WP1 (Past climate variability) aimed to provide consolidated data to other WPs in ClimAfrica, and to analyze the interactions between climate variability, water availability and ecosystem productivity of Sub-Saharan Africa. Various data streams that diagnose the variability of the climate, in particular the water cycle, and the productivity of ecosystems in the past decades, have been collected, analyzed and synthesized. The data streams range from ground-based observations and satellite remote sensing to model simulations. More information on ClimAfrica project is provided in the Supplemental Information section of this metadata.
-
This dataset forms part of a global livestock mapping project by the Food and Agriculture Organization's Animal Production and Health Division (FAO-AGA). The methodology and sources of data are fully described in a document entitled: "The Gridded Livestock of the World FAO (2007)". In summary, for each country the most recent available sub-national livestock census data and corresponding administrative boundaries have been collected. These are then converted into densities, excluding land unsuitable for livestock (either monogastric or ruminant), to provide the 'observed' data. The data are then disaggregated based on statistical relations with some environmental variables in similar agro-ecological zones to produce the 'predicted' distribution. The predicted data are further manipulated to match national census totals for the year 2000 and the year 2005 according to the FAOSTAT database. The project includes: a global network of data providers on livestock and sub-national boundaries; an Oracle database in which these data are managed and processed; a system for predicting livestock distributions based on environmental data and an interactive web application, the Global Livestock Production and Health Atlas (GLiPHA - http://www.fao.org/ag/aga/glipha/index.jsp), through which data are viewed and disseminated. The files are in a raster GRID format, with an ArcGis layer file and an ArcView legend file. Pixel values represent actual densities (per square kilometre). Projection details are given in the metadata. The map should ideally be viewed with the overlay of national boundaries, water bodies and unsuitable land. All of these supplementary data are available in accompanying zip files. These data have been produced by FAO's Animal Production and Health Division in collaboration with ERGO and the TALA research group, University of Oxford, UK.
-

This dataset forms part of a global livestock mapping project by the Food and Agriculture Organization's Animal Production and Health Division (FAO-AGA). The methodology and sources of data are fully described in a document entitled: "The Gridded Livestock of the World FAO (2007)". In summary, for each country the most recent available sub-national livestock census data and corresponding administrative boundaries have been collected. These are then converted into densities, excluding land unsuitable for livestock (either monogastric or ruminant), to provide the 'observed' data. The data are then disaggregated based on statistical relations with some environmental variables in similar agro-ecological zones to produce the 'predicted' distribution. The predicted data are further manipulated to match national census totals for the year 2000 and the year 2005 according to the FAOSTAT database. The project includes: a global network of data providers on livestock and sub-national boundaries; an Oracle database in which these data are managed and processed; a system for predicting livestock distributions based on environmental data and an interactive web application, the Global Livestock Production and Health Atlas (GLiPHA - http://www.fao.org/ag/aga/glipha/index.jsp), through which data are viewed and disseminated. The files are in a raster GRID format, with an ArcGis layer file and an ArcView legend file. Pixel values represent actual densities (per square kilometre). Projection details are given in the metadata. The map should ideally be viewed with the overlay of national boundaries, water bodies and unsuitable land. All of these supplementary data are available in accompanying zip files. These data have been produced by FAO's Animal Production and Health Division in collaboration with ERGO and the TALA research group, University of Oxford, UK.