 Stars4Water
FAO-UN Land and Water Division
Type of resources
Available actions
Topics
Keywords
Contact for the resource
Provided by
Years
Formats
Representation types
Update frequencies
status
Scale
Resolution
-
Grid with estimated yearly precipitation with a spatial resolution of 10 arc minutes. The dataset contains average values for global land areas, excluding Antarctica, for the period 1961-1990. The dataset has been prepared according to the FAO Penman - Monteith method with limited climatic data as described in FAO Irrigation and Drainage Paper 56. The dataset consists one ASCII-grid with yearly data in mm/year. ASCII-grids with mean monthly data in mm/day * 10 are also available as described in the associated resources of this metadata.
-
Geo-referenced point database on dams in Africa.
-

Grids with monthly values of coefficient of variation of precipitation for the period 1961-1990, at 5 arc min. Based on: New, M., Lister, D., Hulme, M. and Makin, I., 2002: A high-resolution data set of surface climate over global land areas. Climate Research 21:1-25
-

Global Map of Irrigation Areas - Version 5 Grid with percentage of area equipped for irrigation with a spatial resolution of 5 arc minutes or 0.083333 decimal degrees. This dataset is developed in the framework of the AQUASTAT Programme of the Land and Water Division of the Food and Agriculture Organization of the United Nations and the Rheinische Friedrich-Wilhems University, Germany. The map shows the amount of area equipped for irrigation around the year 2005 in percentage of the total area on a raster with a resolution of 5 minutes. Additional map layers show the percentage of the area equipped for irrigation that was actually used for irrigation and the percentages of the area equipped for irrigation that was irrigated with groundwater, surface water or non-conventional sources of water. In details, the following products have been released and made available for download: (A) Area equipped for irrigation expressed as percentage of total area: total=aei, surface water=aeisw, groundwater=aeigw, non-conventional sources of water=aeinc (ASCII-grid); (B) Area actually irrigated expressed as percentage of area equipped for irrigation (ASCII-grid); (C) Area equipped for irrigation expressed in hectares per cell (ASCII-grid); (D) Irrigated areas v.5 (ESRI shapefile); (E) High and low resolution images (PDF); (F) Quality Assessment (Excel) Due to the map generation method, the quality of the map can never be uniform. The overall quality of the map depends heavily on the individual quality of the data for the different countries.
-

Grid of estimated aridity with a spatial resolution of 10 arc minutes. This dataset represents average yearly precipitation divided by average yearly potential evapotranspiration, an aridity index defined by the United Nations Environmental Programme (UNEP). The classification of the aridity index is: - Classification Aridity Index Global land area - Hyperarid AI < 0.05 - 7.5% of the global land area - Arid 0.05 < AI < 0.20 - 12.1% of the global land area - Semi-arid 0.20 < AI < 0.50 - 17.7% of the global land area - Dry subhumid 0.50 < AI < 0.65 - 9.9% of the global land area
-
Grid with estimated precipitation per month with a spatial resolution of 10 arc minutes. This dataset has been constructed from 27 075 stations with 1961-1990 climatological normals. The dataset consists of 12 ASCII-grids with mean monthly data in mm/day * 10, and one ASCII-grid with yearly data in mm/year. In addition, 12 ASCII-grid with monthly values at 5 arc minutes resolution are made available as input data for a global water balance model (GlobWat).
-
This map shows the extent of land area equipped for irrigation -expressed as percentage- around the turn of the 20th century according to the Global Map of Irrigation Areas (version 4.0.1), together with areas of rainfed agriculture. Data are available from AQUASTAT - programme of the Land and Water Division of the Food and Agriculture Organization of the United Nations.
-
Grid with estimated yearly reference evapotranspiration with a spatial resolution of 10 arc minutes. The dataset contains average values for global land areas, excluding Antarctica, for the period 1961-1990. The dataset has been prepared according to the FAO Penman - Monteith method with limited climatic data as described in FAO Irrigation and Drainage Paper 56. The dataset consists one ASCII-grid with yearly data in mm/year. ASCII-grids with mean monthly data in mm/day * 10 are also available as described in the associated resources of this metadata.
-
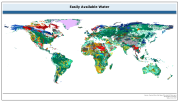
The raster dataset of easily available water has a spatial resolution of 5 * 5 arc minutes and is in geographic projection. Information with regard to available water was obtained from the "Derived Soil Properties" of the FAO-UNESCO Soil Map of the World which contains raster information on soil properties.
-
Grid with estimated reference evapotranspiration per month with a spatial resolution of 10 arc minutes. The dataset contains mean monthly values for global land areas, excluding Antarctica, for the period 1961-1990. The dataset has been prepared according to the FAO Penman - Monteith method with limited climatic data as described in FAO Irrigation and Drainage Paper 56. The dataset consists of 12 ASCII-grids with mean monthly data in mm/day * 10, and one ASCII-grid with yearly data in mm/year.